Disclaimer: This article is for educational and informational purposes only. It does not constitute financial or investment advice. Trading forex and CFDs carries significant risk of loss. Past performance of any strategy — including backtests — does not guarantee future results. Never trade with money you cannot afford to lose.
What Is This Strategy?
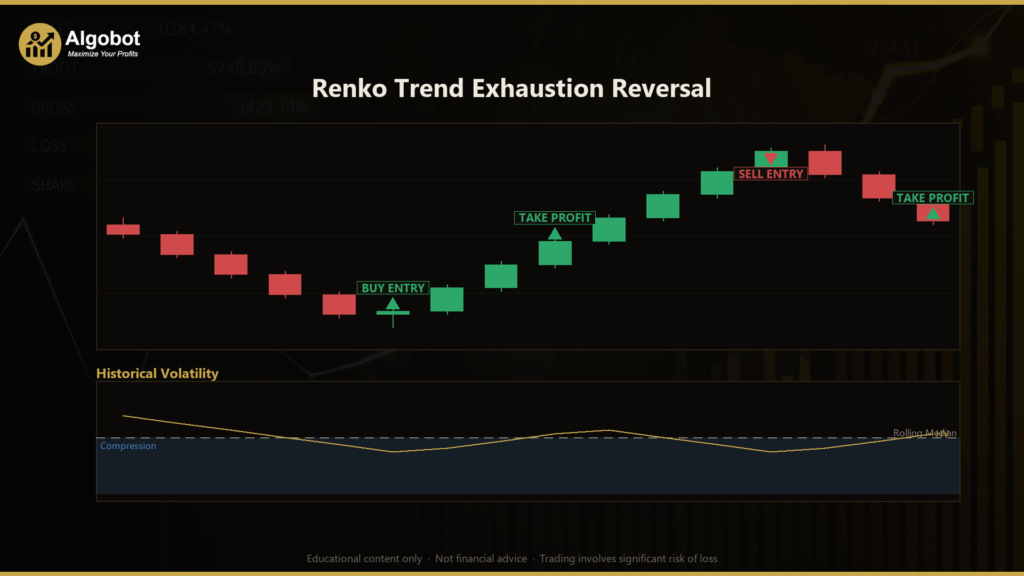
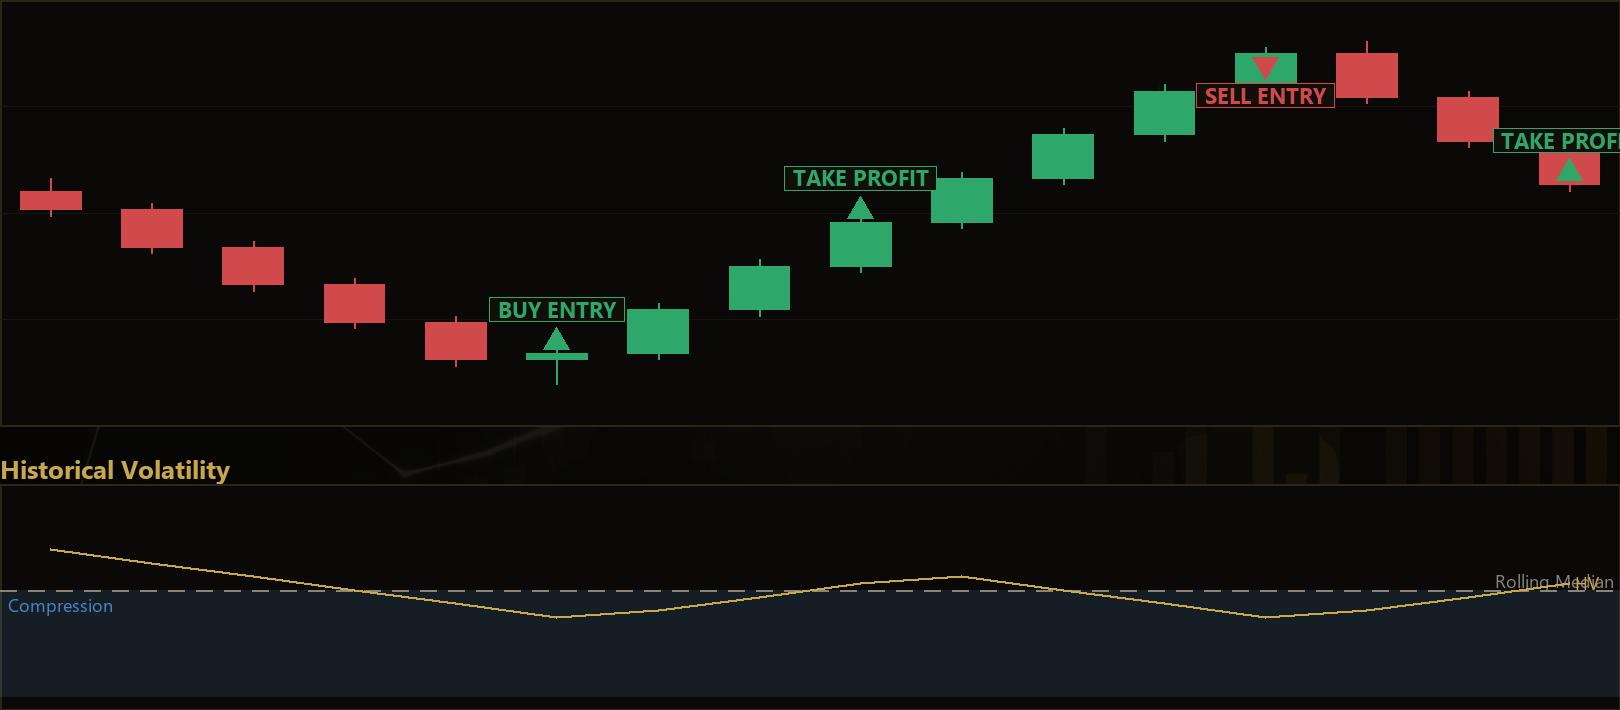
The Renko Trend Exhaustion Reversal is a mean-reversion strategy built on Renko charts and historical volatility (HV) analysis, designed to study how over-extended directional moves behave when the market becomes unusually quiet. Instead of plotting price against time like a standard candlestick chart, a Renko chart builds "bricks" that only appear when price travels a fixed distance. This filters out much of the sideways noise and makes a sustained one-directional run — a long line of same-colored bricks — easy to identify. The strategy watches for those exhausted runs and studies whether fading them (trading in the opposite direction) has statistical merit when volatility is compressed.
The core idea is that a directional move which stretches on and on while the broader tape grows calmer is often running out of participation. In plain terms, the price keeps grinding one way, but the energy behind it — measured by historical volatility — is fading. The strategy combines two independent signals: a Renko brick run (how many consecutive same-direction bricks have printed) and a volatility compression filter (is current HV below its own recent median?). Only when both align does it consider a counter-trend entry.
This EA was designed and tested on the US500 (S&P 500 index CFD) on the H1 (1-hour) timeframe, and it is best treated as a learning tool for traders who want to understand adaptive Renko construction, log-return volatility measurement, and reversal logic. It is not a shortcut to results — it is a structured, transparent example of how volatility-aware mean reversion can be codified into rules you can read, test, and question.
How It Works
The strategy processes one completed H1 bar at a time. On each new bar it rebuilds its Renko state, recalculates volatility, and checks whether the conditions for a fade are present. Here is the logic in plain English:
- Adaptive brick sizing: The Renko brick size is not fixed. It is calculated as
BrickAtrMult × ATR(AtrPeriod), where ATR (Average True Range) is a standard measure of recent price movement. Because ATR is recomputed every bar, the brick size automatically grows in volatile conditions and shrinks in quiet ones, keeping the chart calibrated to the current market. - Brick emission: Each time the closing price moves at least one brick size away from the last brick boundary, a new brick is recorded —
+1for up,-1for down. If a single bar moves far enough, multiple bricks can print at once. The strategy keeps a rolling list of these brick directions. - Run length: From the tail of that list, the strategy counts how many consecutive bricks share the same direction. This "run length" is its measure of trend extension.
- Historical volatility (HV): HV is the standard deviation of the last
HvPeriodlogarithmic returns (the natural log of each close divided by the previous close), annualised with a simple square-root-of-time rule. It captures how energetic recent price changes have been. - Volatility compression filter: The strategy stores a rolling history of HV readings and compares the current value to the rolling median of the last
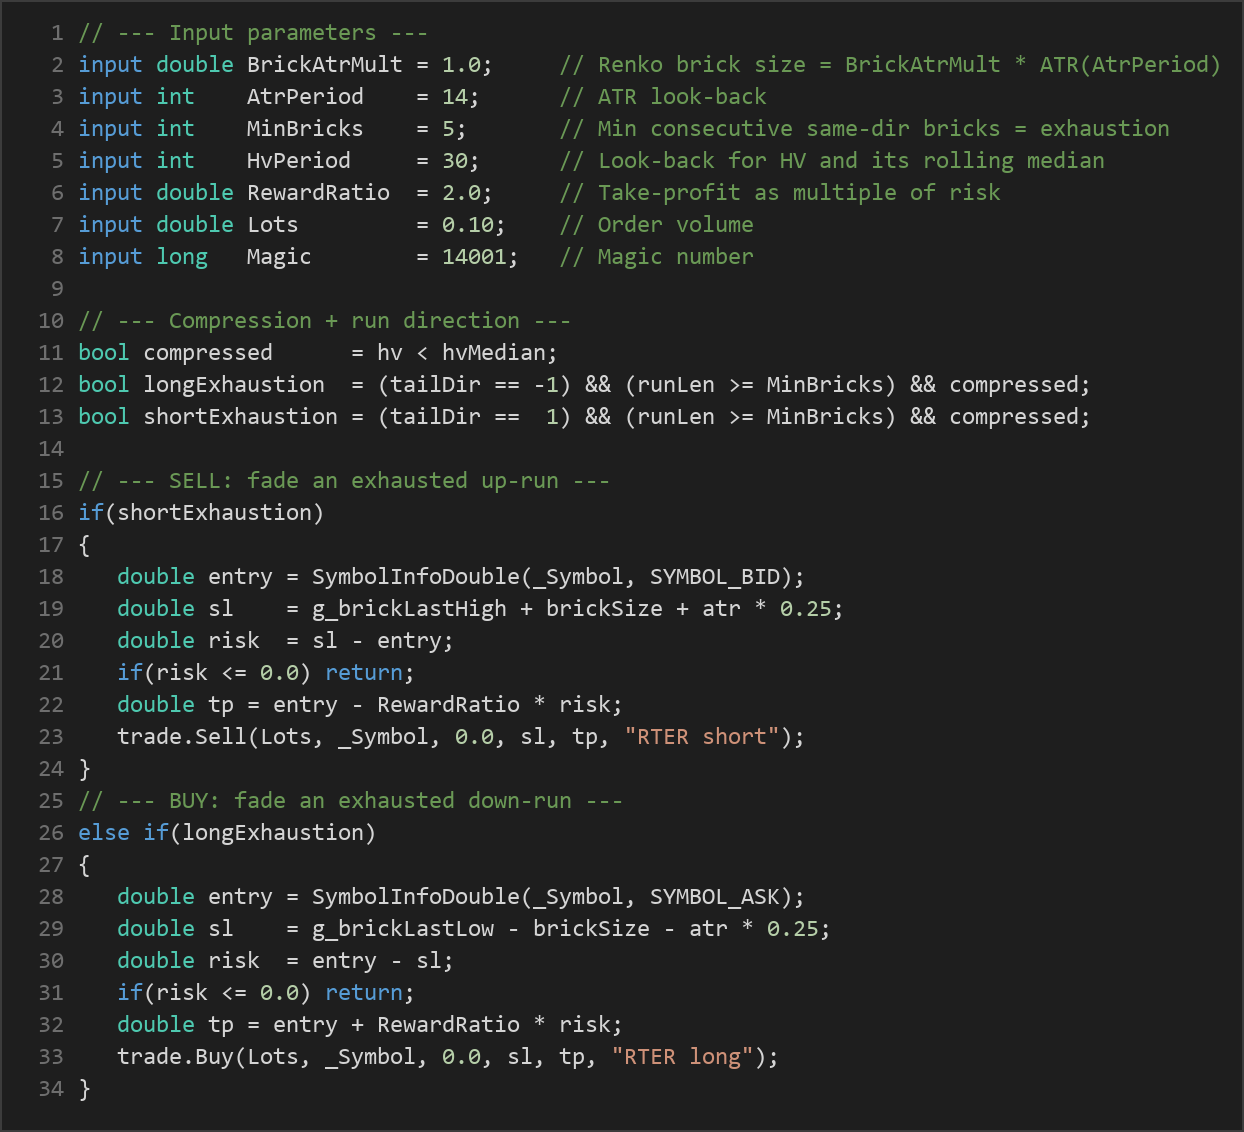
HvPeriodreadings. When current HV sits below that median, the tape is considered "compressed" — quieter than its own recent norm. - Short entry (fade an up-run): When the brick run is up, its length is at least
MinBricks, and volatility is compressed, the strategy signals a short — fading an exhausted rally into a quiet tape. - Long entry (fade a down-run): When the brick run is down, its length is at least
MinBricks, and volatility is compressed, the strategy signals a long — fading an exhausted decline. - One position at a time: The strategy holds only a single open position per symbol and magic number, so signals are ignored while a trade is already live.
- Stop-loss logic: For a short, the stop is placed one brick above the last up-brick top, plus a small ATR buffer (25% of ATR). For a long, it sits one brick below the last down-brick bottom, minus the same buffer. This places protection just beyond the run's structural extreme.
- Take-profit logic: The take-profit is set at
RewardRatio × risk, where risk is the distance from entry to stop. ARewardRatioof 2.0, for example, targets twice the risk distance.
Because both a structural signal (the brick run) and a statistical filter (volatility compression) must agree, the strategy is deliberately selective and may go long stretches without trading.
Strategy Parameters
| Parameter | Default | Min | Max | Description |
|---|---|---|---|---|
| BrickAtrMult | 1.0 | 0.5 | 2.0 | Multiplier applied to ATR to set the Renko brick size. Larger values make bigger, less frequent bricks. |
| AtrPeriod | 14 | 7 | 28 | Look-back length (in bars) for the ATR used to size the bricks and the stop buffer. |
| MinBricks | 5 | 3 | 10 | Minimum number of consecutive same-direction bricks required to declare a run "exhausted." |
| HvPeriod | 30 | 10 | 60 | Look-back for the historical-volatility calculation and its rolling-median compression filter. |
| RewardRatio | 2.0 | 1.0 | 5.0 | Take-profit distance expressed as a multiple of the risk (entry-to-stop) distance. |
| Lots | 0.10 | 0.01 | 1.0 | Order volume in lots. Governs position size and should be matched to your account risk. |
| Magic | 14001 | 1 | 99999 | Unique identifier the EA uses to track its own positions. Keep it constant across optimization runs. |
The developer notes suggest optimising BrickAtrMult, MinBricks, HvPeriod, and RewardRatio while holding Magic fixed, so the EA can always recognise the trades it owns.
Recommended Chart Settings
This strategy was designed for the US500 (S&P 500 CFD) on the H1 timeframe. The Renko brick sizing, the ATR look-back, and the ~1638-bars-per-year annualisation constant used in the HV calculation are all tuned around H1 index data.
You can experiment with other symbols and timeframes on a demo account, but be aware that the volatility characteristics of forex pairs, commodities, or crypto differ substantially from an equity index. Any change in symbol or timeframe should be re-tested from scratch, because results will vary considerably across different instruments and market conditions.
How to Install on MetaTrader 5
- Download the
.ex5file from the link below - Copy it to your MT5
MQL5\Expertsfolder - Restart MetaTrader 5 or refresh the Navigator panel
- Drag the EA onto a chart matching the recommended symbol and timeframe
- Configure the input parameters and enable Algo Trading
What to Consider Before Using This EA
Like any single approach, the Renko Trend Exhaustion Reversal has both strengths and clear limitations, and it is worth weighing them honestly before you rely on it.
Strengths. The adaptive brick sizing keeps the Renko structure relevant as volatility shifts, rather than using a fixed brick size that becomes too coarse or too fine over time. Requiring two independent conditions — an extended run and volatility compression — makes the entries selective and helps filter out random noise. The stop and target are both defined structurally and mathematically, so risk is quantified before every trade.
Limitations. Counter-trend, mean-reversion strategies share a well-known weakness: they fade moves, which means a genuinely strong trend can run straight through the entry and hit the stop repeatedly. A "quiet" tape can stay quiet — or a compression reading can precede a volatility expansion rather than a reversal — so the compression filter is a probabilistic edge, not a certainty. Renko charts also react only to closing prices at the defined brick size, so intrabar spikes may be under-represented. Finally, because the strategy takes only one position at a time and waits for two aligned conditions, it can be inactive for long periods, which some traders find difficult to stick with.
Where it may underperform. Strongly trending, high-momentum regimes — where an index grinds in one direction with steady or rising volatility — are the least favourable environment for a fade. Choppy but expanding-volatility conditions can also generate signals that reverse against the position. This makes thorough backtesting and forward-testing across multiple market regimes essential.
Risk Management Tips
Sound risk management matters more than any single parameter setting. Consider these general principles as you study the strategy:
- Risk a small fixed percentage per trade. Many educators suggest risking no more than 1–2% of account equity on any one position, so a string of losses cannot do disproportionate damage.
- Size positions to your stop, not the other way around. Use the
Lotsinput together with the stop distance to keep each trade's monetary risk within your chosen percentage. - Start on a demo account. Run the EA in a risk-free simulated environment first to understand its trade frequency, drawdown behaviour, and how it reacts in different market conditions before committing real capital.
- Understand drawdown. Every strategy experiences losing streaks. Know the historical maximum drawdown you are comfortable with, and decide in advance how you will respond if it is exceeded.
- Avoid over-optimisation. Tuning parameters until a backtest looks perfect often produces a "curve-fit" that fails on new data. Favour settings that are robust across a range of values rather than a single fragile sweet spot.
- Never risk money you cannot afford to lose. Leverage magnifies both gains and losses, and no rule set removes the possibility of loss.
Risk Warning
Trading foreign exchange, CFDs, and other leveraged financial instruments involves substantial risk of loss and is not suitable for all investors. The strategies and tools discussed on this page are provided for educational purposes only and do not constitute financial advice, investment recommendations, or solicitation to trade. Always consult a qualified financial adviser before making trading decisions. Past backtest performance is not indicative of future results.
Downloads
- Expert Advisor: RenkoTrendExhaustionReversal.ex5 (28 downloads)
- Source Code: RenkoTrendExhaustionReversal.mq5 (44 downloads)
- Documentation: RenkoTrendExhaustionReversal.pdf (56 downloads)