Disclaimer: This article is for educational and informational purposes only. It does not constitute financial or investment advice. Trading forex and CFDs carries significant risk of loss. Past performance of any strategy — including backtests — does not guarantee future results. Never trade with money you cannot afford to lose.
What Is This Strategy?
Settlement Barycenter Drift is a trend-conviction trading strategy for MetaTrader 5 that reads price action purely from raw candlestick geometry — the open, high, low, and close of each completed bar — rather than from any traditional indicator, chart pattern, or support/resistance concept. Its core measurement tool is a custom "drift" oscillator built from two dimensionless bar statistics (a traverse value and a settlement value), which are combined, smoothed with a leaky integrator, and then converted into a self-adapting z-score (a statistical measure of how far a value sits from its recent average). The trading style is systematic trend-following with adaptive, volatility-based risk controls.
The strategy is designed for markets that develop and sustain directional conviction — periods where buyers or sellers not only push price but hold it into the close, bar after bar. Because every calculation is normalised by each bar's own range, the model aims to behave consistently across calm and volatile regimes alike, standardising its own signal against recent history before it acts. This makes it a strategy that attempts to tune itself to whatever instrument and timeframe it runs on.
As a learning tool, Settlement Barycenter Drift is well suited to intermediate traders who want to study how candle shape — not just candle direction — can be quantified into a single conviction score. It demonstrates several advanced concepts in one package: range normalisation, exponential memory, statistical standardisation, and model-native exits. It is not a shortcut to results and should be treated as an educational framework for understanding auction-based price analysis.
How It Works
The strategy processes one completed candle at a time (it acts once per bar, evaluating the bar that has just closed). Each finished bar is treated as the record of a completed auction, and the model asks two questions about it.
- Traverse (delta):
(Close − Open) / Range. This measures the signed fraction of the bar's range that net order flow carried price from open to close — "effort that produced result." It ranges from −1 to +1. - Settlement (beta):
(2 × Close − High − Low) / Range. This measures where inside the range price finally came to rest — +1 means it closed right at the high (buyers held the top), −1 means it closed at the low. It also ranges from −1 to +1.
The strategy then builds its signals as follows:
- Per-bar conviction (kappa): the average of traverse and settlement,
0.5 × delta + 0.5 × beta. Genuine directional conviction requires both — price was driven and held. A bar that pushed up but closed weak, or settled high but barely moved, cancels toward zero. - The drift (D): conviction is accumulated through a leaky integrator with memory,
D_t = lambda × D_{t−1} + (1 − lambda) × kappa, wherelambda = P / (P + 1). This running value is the "settlement barycenter drift" — the moving centre of directional control. Larger memory produces a smoother, slower drift. - The z-score: the raw drift is standardised against its own recent distribution over a rolling window,
z = (D − mean) / standard deviation. This is what lets the strategy self-adapt: in calm regimes the standard deviation shrinks, so smaller absolute drifts qualify as significant; in violent regimes it demands more.
Entry conditions (symmetric long and short):
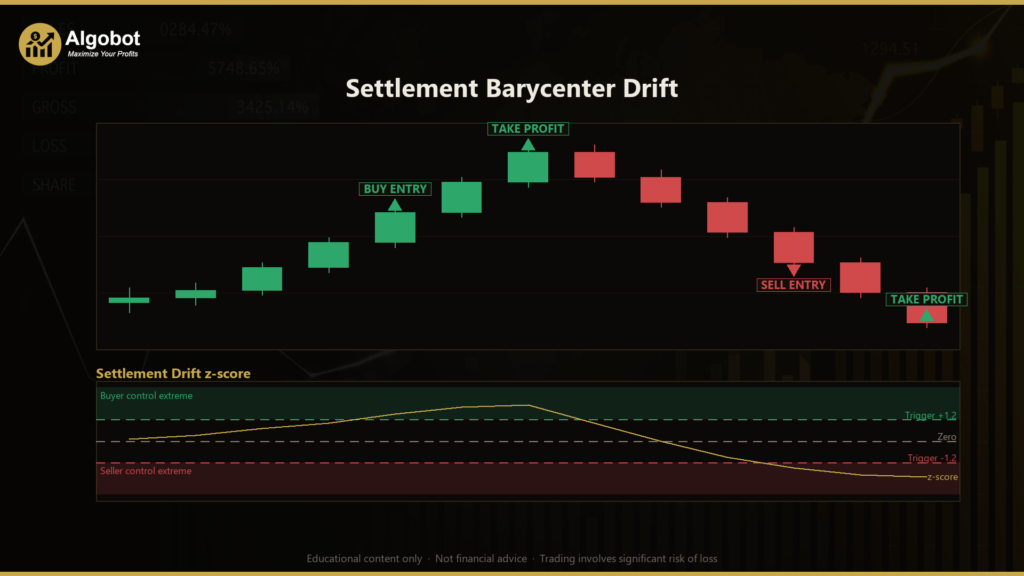
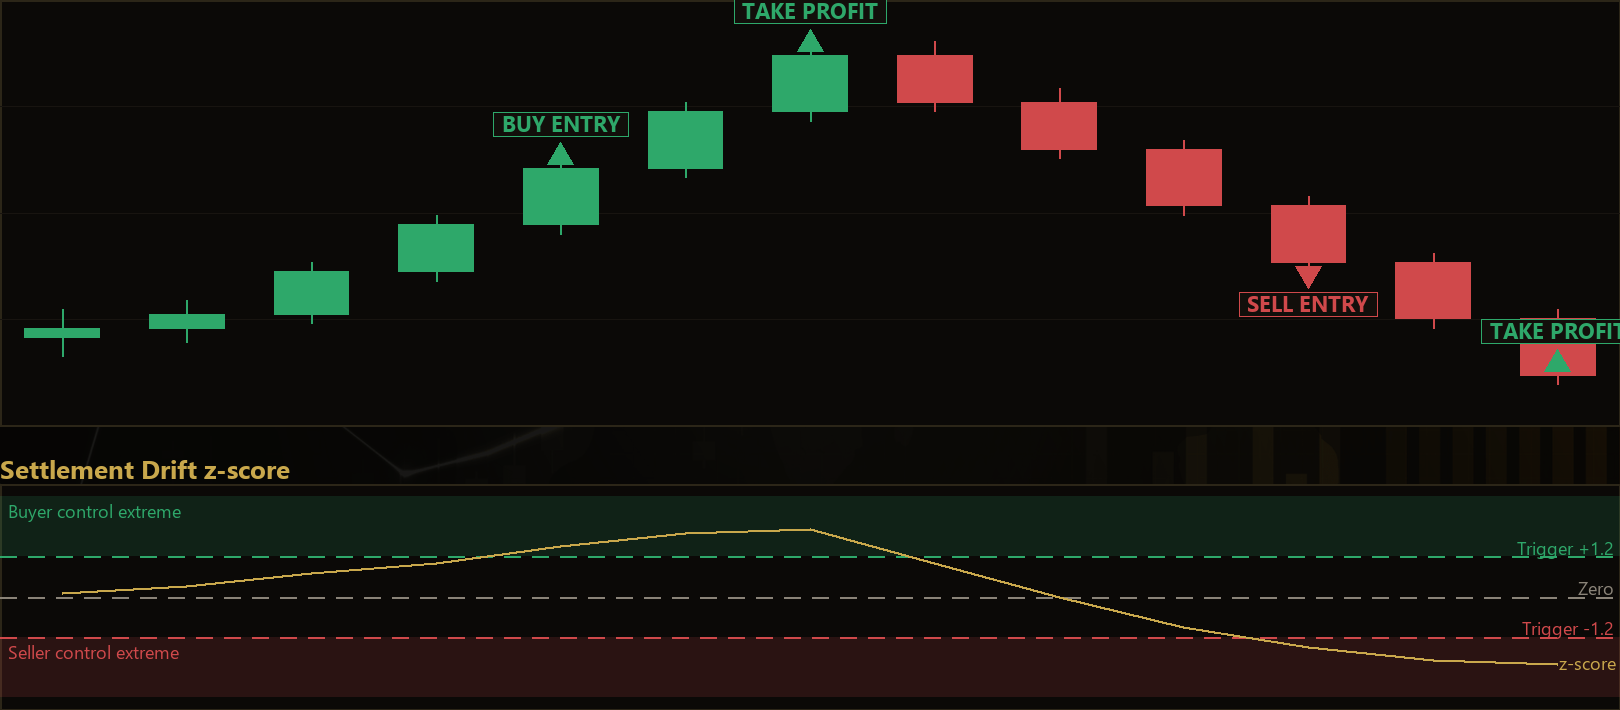
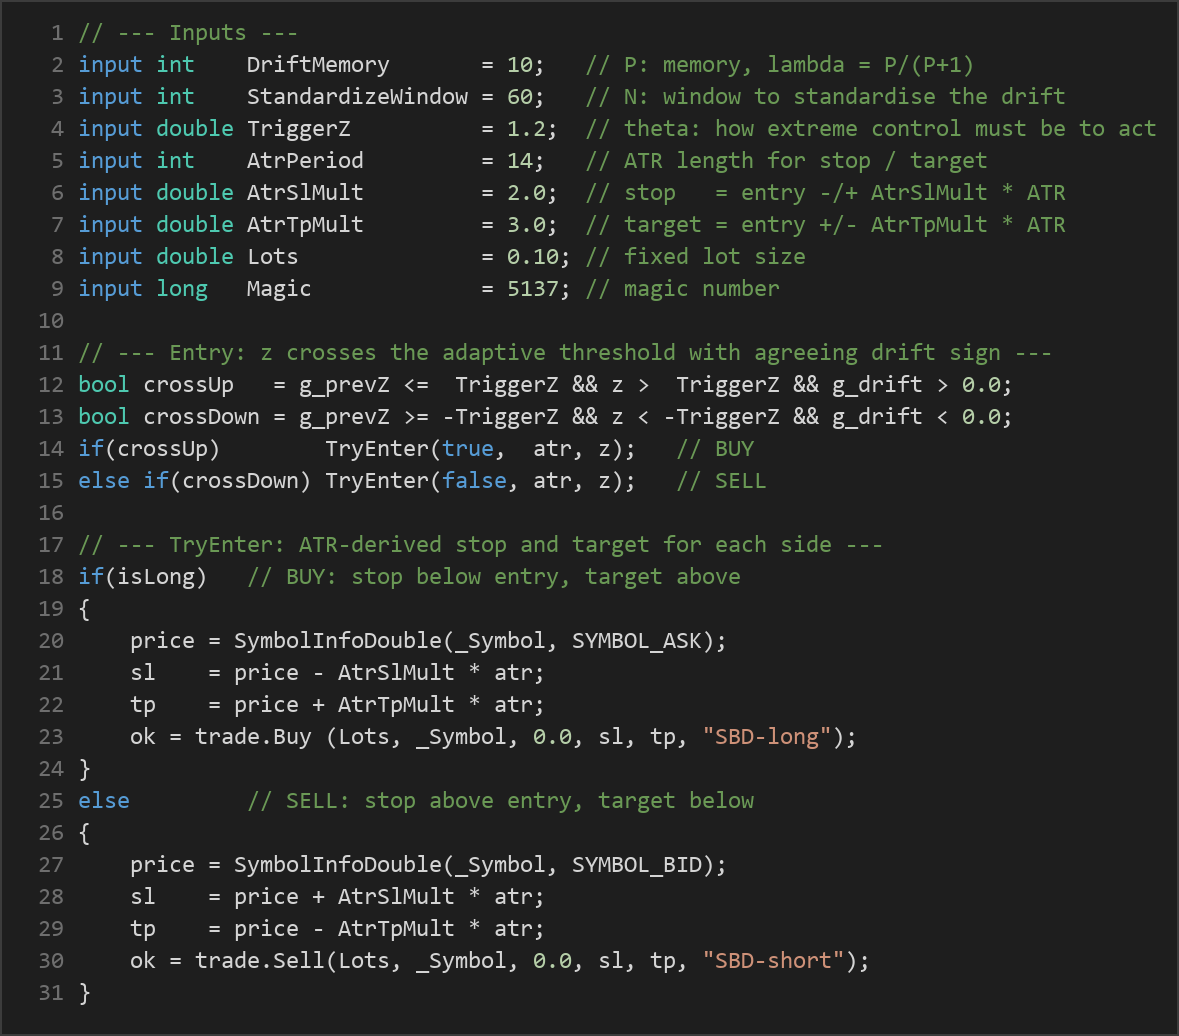
- The strategy signals a long when the z-score crosses up through the positive trigger threshold while the drift itself is positive — buyers' control has become statistically extreme for this market right now.
- The strategy signals a short when the z-score crosses down through the negative trigger threshold while the drift is negative.
- Entries are cross-triggered, meaning the strategy acts on the transition through the threshold, not on every bar that remains extended. Only one position per magic number is allowed at a time — it never stacks trades.
Exit and risk logic:
- Stop-loss: placed at
entry − (AtrSlMult × ATR)for longs andentry + (AtrSlMult × ATR)for shorts. ATR (Average True Range) is a volatility measure, so the stop distance widens or tightens with market conditions. - Take-profit: placed at
entry + (AtrTpMult × ATR)for longs and the mirror for shorts. - Control-flip exit: a model-native exit that closes an open trade the moment the drift crosses back through zero against the position. When the barycenter of control changes hands, the strategy treats the original thesis as void and exits regardless of price — adapting to structure rather than waiting for a fixed level.
Strategy Parameters
| Parameter | Default | Min | Max | Description |
|---|---|---|---|---|
| DriftMemory | 10 | 3 | 40 | Memory P of the leaky conviction integrator (lambda = P/(P+1)). Larger values give a longer memory, smoother and slower drift. |
| StandardizeWindow | 60 | 20 | 200 | Rolling window N (in bars) used to standardise the drift into a z-score. Wider windows judge "extreme" against a longer history. |
| TriggerZ | 1.2 | 0.5 | 3.0 | The z-score threshold (theta) — how statistically extreme control must be before the strategy acts. Higher values demand stronger conviction. |
| AtrPeriod | 14 | 7 | 30 | ATR length (in bars) used to measure volatility for stop-loss and take-profit distances. |
| AtrSlMult | 2.0 | 0.5 | 5.0 | Stop-loss distance as a multiple of ATR. Larger values place a wider stop. |
| AtrTpMult | 3.0 | 0.5 | 8.0 | Take-profit distance as a multiple of ATR. Larger values set a more distant target. |
| Lots | 0.10 | 0.01 | 1.0 | Fixed lot size for each position. Adjust to suit your account size and risk tolerance. |
Recommended Chart Settings
Settlement Barycenter Drift is a single-timeframe strategy: every bar calculation uses the chart's own timeframe, so it runs on whatever timeframe you attach it to. This makes the chart timeframe an important choice rather than a fixed setting. A common starting point for study is a liquid major forex pair such as EUR/USD on the H1 (1-hour) chart, which offers enough bars for the standardisation window to fill while keeping each auction meaningful.
Because the model normalises everything by each bar's range and standardises its drift against recent history, it is deliberately built to adapt across instruments and timeframes. That said, results will vary considerably across different symbols, timeframes, and market conditions. Always study the strategy's behaviour on your chosen market in a testing environment before drawing any conclusions, and remember that a setting that suits one regime may not suit another.
How to Install on MetaTrader 5
- Download the .ex5 file from the link below
- Copy it to your MT5
MQL5\Expertsfolder - Restart MetaTrader 5 or refresh the Navigator panel
- Drag the EA onto a chart matching the recommended symbol and timeframe
- Configure the input parameters and enable Algo Trading
What to Consider Before Using This EA
Every strategy has strengths and limitations, and an honest understanding of both is essential.
Strengths of this approach:
- Regime-invariant measurement. By normalising every calculation by each bar's range and standardising the drift against its own recent distribution, the model attempts to mean the same thing in calm and volatile conditions alike.
- Two-factor confirmation. Requiring both traverse and settlement to agree filters out bars that pushed but failed to hold, which may reduce reaction to noisy, indecisive candles.
- Adaptive exits. The ATR-based stops and the control-flip exit adjust to structure and volatility instead of relying on a single fixed distance.
Known limitations:
- Trend dependence. Like most conviction-following systems, it is built for markets that develop and sustain direction. In choppy, range-bound, or sideways conditions the z-score may cross thresholds only to reverse, producing whipsaw entries.
- Warm-up requirement. The strategy needs a full standardisation window of bars plus enough history for ATR before it can trade at all, so it does nothing until sufficient data has accumulated.
- Parameter sensitivity. Memory length, window size, and the z-trigger interact. Over-tuning them to past data (curve-fitting) can produce a configuration that looks tidy in hindsight but does not generalise.
- Fixed-lot sizing. Position size does not scale with account equity or stop distance, so risk per trade must be managed manually.
The strategy may underperform during low-volatility drift, news-driven spikes, or extended consolidation, where directional control is genuinely ambiguous. Treat it as an analytical framework to study, not a finished solution.
Risk Management Tips
Sound risk management matters more than any single entry signal. Consider these general principles as part of your education:
- Risk a small, fixed fraction per trade. Many educational sources suggest risking no more than 1–2% of account equity on any single position. Because this EA uses a fixed lot size, calculate what your stop distance means in currency terms and adjust the
Lotsvalue accordingly. - Test on a demo account first. Run the strategy in a risk-free demo environment and in the Strategy Tester before ever considering live capital, so you can observe how it behaves across different conditions.
- Understand drawdown. Every strategy experiences losing streaks. Study the historical drawdown of your configuration and ask whether you could tolerate that decline emotionally and financially.
- Mind position sizing and leverage. Larger lots and higher leverage amplify both gains and losses. Keep sizing conservative while you are learning.
- Diversify and avoid over-optimisation. Do not judge a configuration solely on how well it fit past data. Favour robust settings that perform reasonably across a range of conditions over ones that look perfect only in hindsight.
Risk Warning
Trading foreign exchange, CFDs, and other leveraged financial instruments involves substantial risk of loss and is not suitable for all investors. The strategies and tools discussed on this page are provided for educational purposes only and do not constitute financial advice, investment recommendations, or solicitation to trade. Always consult a qualified financial adviser before making trading decisions. Past backtest performance is not indicative of future results.
Downloads
- Expert Advisor: SettlementBarycenterDrift.ex5 (49 downloads)
- Source Code: SettlementBarycenterDrift.mq5 (56 downloads)
- Documentation: SettlementBarycenterDrift.pdf (50 downloads)