Disclaimer: This article is for educational and informational purposes only. It does not constitute financial or investment advice. Trading forex and CFDs carries significant risk of loss. Past performance of any strategy — including backtests — does not guarantee future results. Never trade with money you cannot afford to lose.
What Is This Strategy?
The Arcsine Extremum Trend strategy is a trend-detection Expert Advisor (EA) for MetaTrader 5 built on order-statistics from random-walk fluctuation theory rather than a conventional charting indicator. Instead of moving averages, oscillators, or support/resistance lines, it reads raw OHLC (open-high-low-close) price data and compares what the market actually did against what a driftless market — one with no genuine directional bias — would be expected to do. The statistical foundation is a pair of classic results known as Paul Lévy's arcsine laws, which describe the U-shaped probability distributions that govern where the extremes of a fair random walk tend to fall in time.
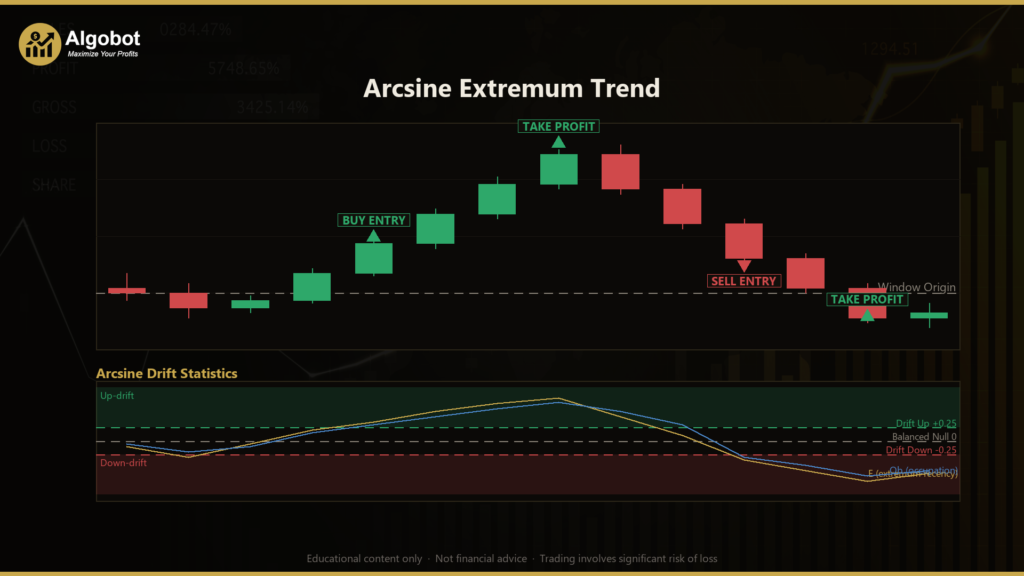
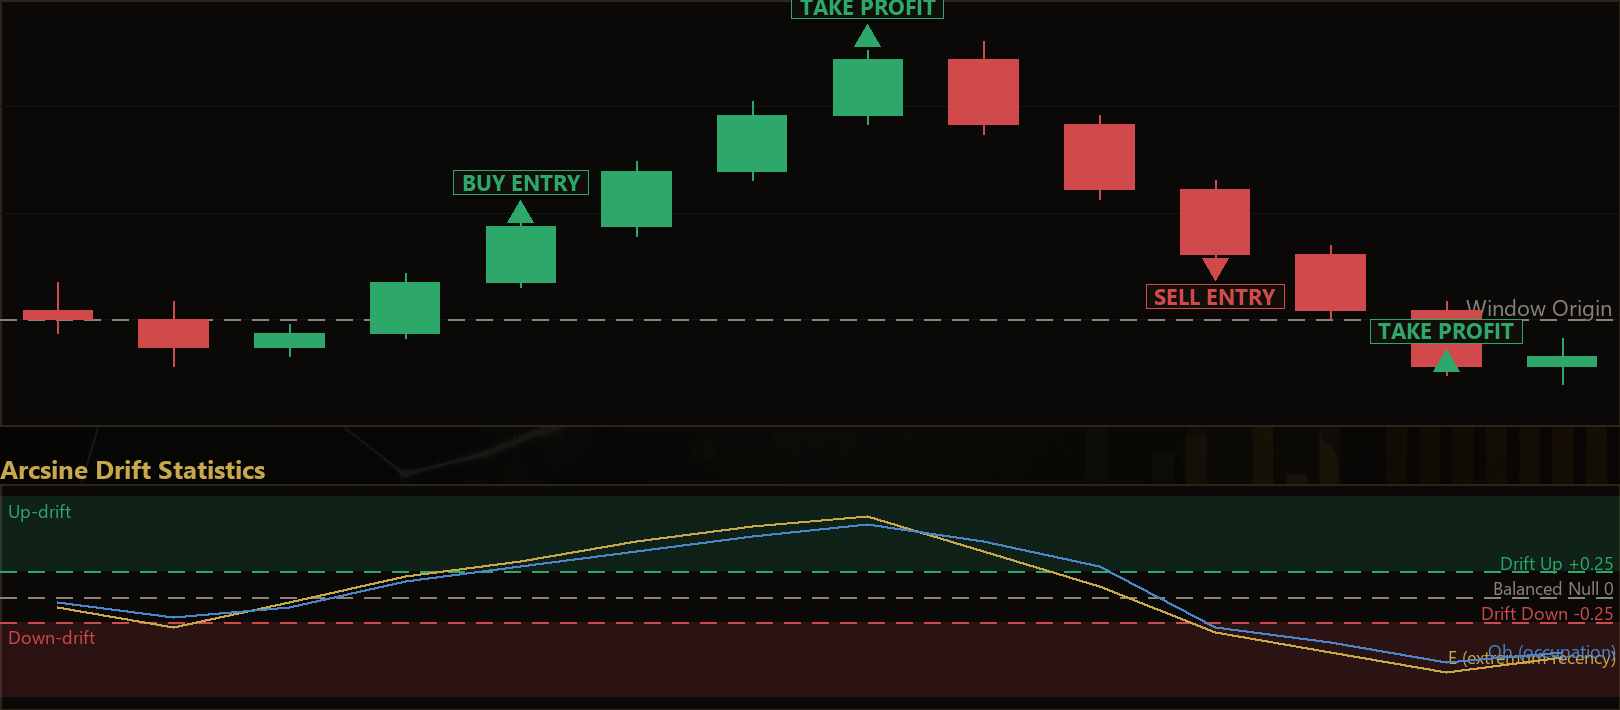
In plain terms, the strategy asks a simple question: does the recent price path look like pure random noise, or does it show the fingerprint of a real trend? When a market is genuinely drifting upward, the highest high keeps getting renewed toward the present moment while the lowest low sits stranded early in the window, and price spends most of its time above where it started. The strategy measures exactly this kind of asymmetry and only trades when the evidence for drift is strong on two independent statistics at once.
As a learning tool, this EA is well suited to traders who want to understand a first-principles, mean-reversion-of-the-null approach to trend following — one grounded in probability theory rather than pattern recognition. It is designed for liquid, trend-capable instruments (forex majors, indices, and metals) and is best studied as an analysis framework, not as a shortcut to returns. If you are curious about how statistical hypothesis testing can be turned into a mechanical trading filter, this is an instructive example.
How It Works
The strategy operates on closed bars only, evaluating its logic once per newly completed candle on the chart's timeframe. Over a rolling window of the last N closed bars, it computes two normalized statistics that are each exactly zero-mean and symmetric under the "no drift" assumption. Here is the process in plain English:
- Extremum-recency asymmetry (E): The strategy finds how many bars ago the window's highest high occurred (
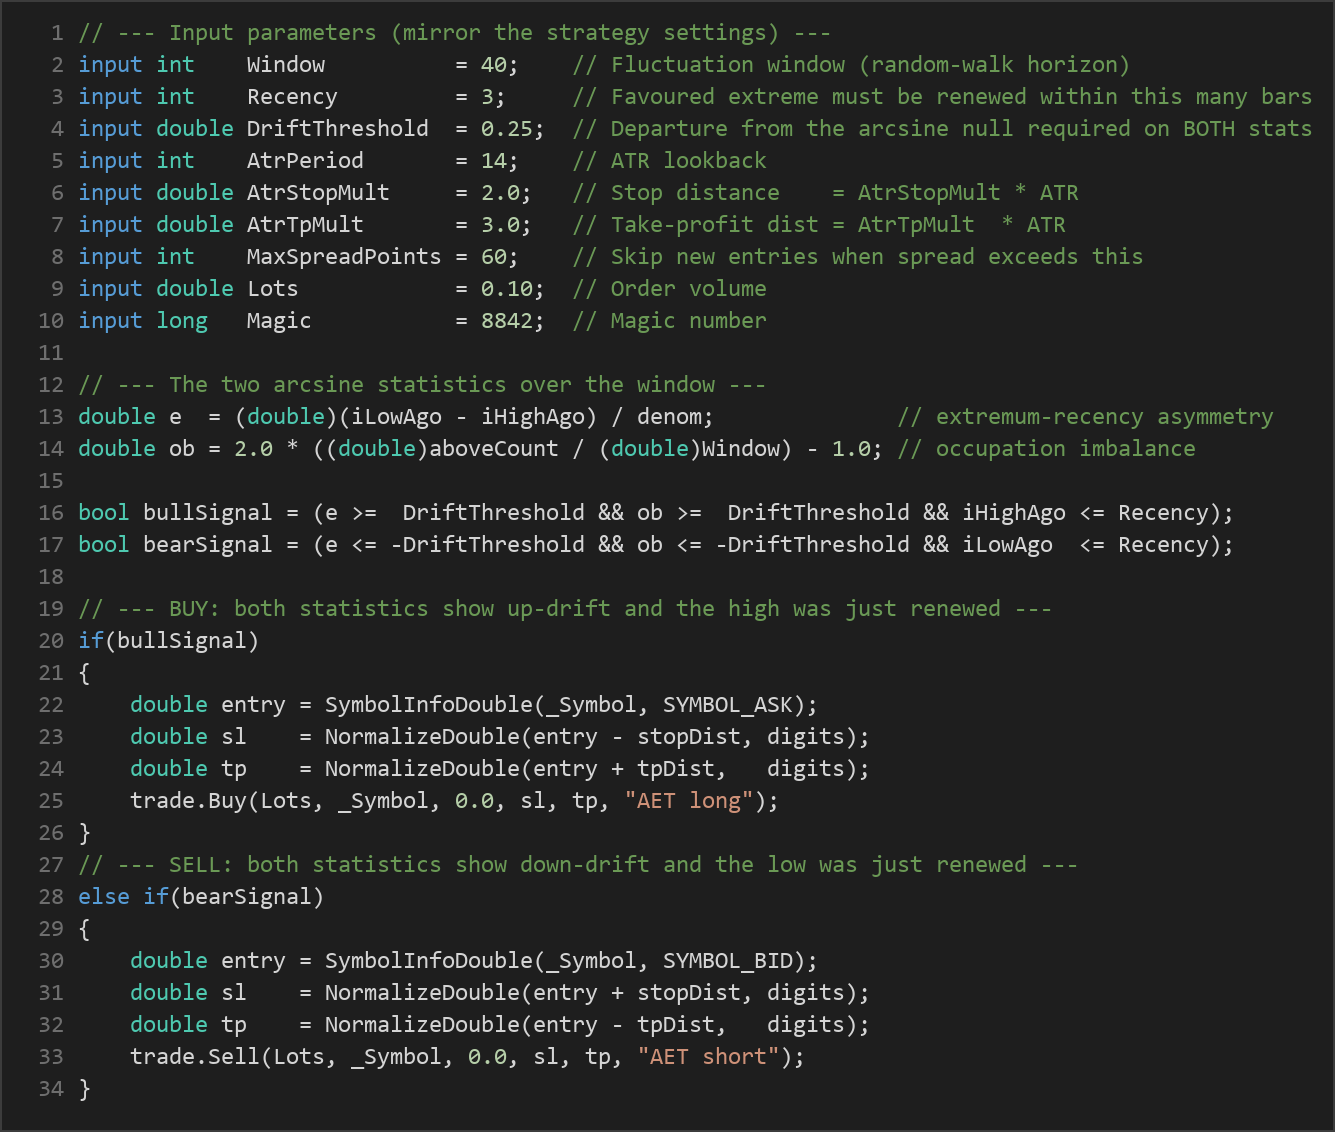
iHigh) and how many bars ago the lowest low occurred (iLow). It then computesE = (iLow − iHigh) / (N−1), a value between −1 and +1. A positive E means the high was renewed more recently than the low, which historically signals up-drift; a negative E signals down-drift. - Occupation imbalance (Ob): Using the first close of the window as the "origin," the strategy counts how many closing prices sat strictly above that origin, then rescales the fraction to
Ob = 2 × (share above origin) − 1, again between −1 and +1. Values near +1 mean price spent most of the window above its starting point (up-drift); values near −1 mean the opposite.
Entry conditions require agreement across both statistics and a freshness check:
- The strategy signals a long when E is at or above the drift threshold, Ob is at or above the drift threshold, and the highest high was renewed within the last Recency bars (the up-leg is still being actively pushed, not stale).
- The strategy signals a short when E is at or below the negative threshold, Ob is at or below the negative threshold, and the lowest low was renewed within the last Recency bars.
Exit and position management:
- Stop-loss is volatility-scaled: it is placed at
AtrStopMult × ATRaway from the entry price, where ATR (Average True Range) measures recent price movement. - Take-profit is placed at
AtrTpMult × ATRfrom entry, so both risk and reward automatically expand and contract with market volatility. - One position per magic number is enforced — the strategy never stacks trades.
- If an opposite drift signal appears while a position is open (for example, a bearish signal while long), the strategy closes the position, treating it as evidence that the statistical "null" has now been rejected in the other direction. A fresh entry can then form on a later bar.
- Entries are also skipped when the spread is too wide, protecting against poor execution conditions.
Because the window statistics renormalize to a fixed [−1, 1] range and the ATR-based stops rescale with volatility, the same threshold keeps a consistent statistical strictness across different symbols and market regimes.
Strategy Parameters
| Parameter | Default | Min | Max | Description |
|---|---|---|---|---|
| Window | 40 | 15 | 150 | Number of closed bars in the fluctuation window — the random-walk horizon over which the two arcsine statistics are measured. |
| Recency | 3 | 0 | 15 | The favoured extreme (high for longs, low for shorts) must have been renewed within this many bars, ensuring the trend leg is fresh rather than stale. |
| DriftThreshold | 0.25 | 0.05 | 0.80 | How far both arcsine statistics must depart from the zero-mean null before a trade is allowed. Higher values are more conservative. |
| AtrPeriod | 14 | 5 | 30 | Lookback length for the ATR calculation used to size the stop and take-profit. |
| AtrStopMult | 2.0 | 0.5 | 5.0 | Stop-loss distance as a multiple of ATR, measured from the entry price. |
| AtrTpMult | 3.0 | 0.5 | 8.0 | Take-profit distance as a multiple of ATR, measured from the entry price. |
| MaxSpreadPoints | 60 | 5 | 300 | New entries are skipped when the current spread (in points) is wider than this value. |
| Lots | 0.10 | 0.01 | 1.0 | Order volume in lots for each trade. |
| Magic | 8842 | 0 | 9,999,999 | Unique identifier so the EA manages only its own positions. |
Recommended Chart Settings
The Arcsine Extremum Trend EA is designed for any liquid, trend-capable instrument — forex majors such as EUR/USD or GBP/USD, major stock indices, and metals like gold — on intraday-to-swing timeframes. It reads whatever timeframe the chart is set to, so an H1 (1-hour) or H4 (4-hour) chart is a reasonable starting point for study, giving each window of 40 bars a meaningful span of market activity. Because the statistics and risk model self-normalize, you can experiment across symbols and timeframes, but remember that results will vary considerably across different market conditions, and a setting that behaved one way in a trending phase may behave very differently in a range.
How to Install on MetaTrader 5
- Download the .ex5 file from the link below
- Copy it to your MT5
MQL5\Expertsfolder - Restart MetaTrader 5 or refresh the Navigator panel
- Drag the EA onto a chart matching the recommended symbol and timeframe
- Configure the input parameters and enable Algo Trading
What to Consider Before Using This EA
Strengths of this approach. The strategy's most distinctive quality is that its entry filter is anchored to a known statistical null model. Requiring two independent, self-normalizing statistics to agree before trading is a genuinely conservative design that helps avoid acting on random noise. The ATR-based stops and targets adapt to volatility automatically, and the "close on opposite signal" rule gives the logic a clear, rules-based way to exit when the evidence flips.
Known limitations. No statistical filter can distinguish a real trend from a lucky streak with certainty — the arcsine laws describe tendencies, not guarantees, and false signals will occur, especially in choppy or news-driven markets. The strategy is fundamentally trend-following, so it may underperform during extended ranging or mean-reverting conditions where drift signals appear and then quickly reverse. The fixed lot size means position sizing does not scale with account equity or per-trade risk unless you adjust it manually. And like all EAs, its behaviour depends heavily on the parameter values you choose; a threshold that is too low will over-trade, while one that is too high may rarely trade at all.
This EA is best treated as an educational framework for studying statistical trend detection, not as a finished, hands-off system. Thorough forward testing on a demo account across varied market regimes is essential before drawing any conclusions.
Risk Management Tips
Sound risk management matters far more than any single entry signal. Consider these general principles as you study this strategy:
- Risk only a small fraction per trade. A common educational guideline is to risk no more than 1–2% of account equity on any single position. Set your lot size accordingly rather than leaving it at a fixed default.
- Always start on a demo account. Test the EA in simulated conditions until you understand how it behaves in trending, ranging, and volatile markets.
- Understand drawdown. Every strategy experiences losing streaks. Know how large a peak-to-trough decline you could tolerate emotionally and financially before committing real capital.
- Respect the stop-loss. The ATR-scaled stop is central to this design — never disable or widen it arbitrarily to avoid taking a loss.
- Diversify and avoid over-leverage. Concentrating too much risk in one instrument or using excessive leverage can amplify losses quickly.
Risk Warning
Trading foreign exchange, CFDs, and other leveraged financial instruments involves substantial risk of loss and is not suitable for all investors. The strategies and tools discussed on this page are provided for educational purposes only and do not constitute financial advice, investment recommendations, or solicitation to trade. Always consult a qualified financial adviser before making trading decisions. Past backtest performance is not indicative of future results.
Downloads
- Expert Advisor: ArcsineExtremumTrend.ex5 (0 downloads)
- Source Code: ArcsineExtremumTrend.mq5 (0 downloads)
- Documentation: ArcsineExtremumTrend.pdf (0 downloads)