Disclaimer: This article is for educational and informational purposes only. It does not constitute financial or investment advice. Trading forex and CFDs carries significant risk of loss. Past performance of any strategy — including backtests — does not guarantee future results. Never trade with money you cannot afford to lose.
What Is This Strategy?
Temporal Occupancy Drift is an original, first-principles trend-regime strategy built around a single statistical primitive — the occupation fraction of recent price — rather than any conventional indicator, chart pattern, or published trading method. Its trading style is best described as low-lag regime detection: it tries to read which side of a reference price the market has been "living on" and then acts the moment that dominance becomes decisive. The occupation fraction simply measures the share of recent bars whose close sits above a fixed reference point, so it behaves like a robust, aggregated vote on direction rather than a single-bar trigger.
The idea draws on Lévy's arcsine law, a result from probability theory. For a driftless random walk, the fraction of time the path spends on one side of its starting point is not clustered around 50% as intuition suggests — it is U-shaped, piling up near 0% or 100%. In plain terms, occupation is "metastable": a market that has recently spent most of its time above where it started tends to keep doing so longer than a coin-flip would imply, and any genuine directional drift only deepens that lean. The strategy treats a freshly-formed, strong imbalance as evidence that one side owns the recent path.
As a learning tool, Temporal Occupancy Drift is well suited to traders who want to study regime-following logic and volatility-adaptive thresholds without the lag of moving averages. Because the signal reads the sign of an entire window at once, it offers an instructive contrast to smoothed indicators. It is designed for trending or persistently directional conditions and is best approached as a study in statistical market structure — an analysis exercise, not a shortcut.
How It Works
The strategy evaluates one completed bar at a time on a single timeframe. On each newly-closed bar it recalculates its core quantities and checks for a signal. Here is the logic in plain English:
- The origin: The strategy looks back
Windowbars and marks the close there as the "origin" — the reference price the window is measured against. - Occupation fraction (f): It counts how many of the last
Windowcloses finished above that origin, then divides byWindow. This gives a value between 0 and 1. - Centred imbalance (g): The fraction is re-scaled to a signed value
g = 2f − 1, ranging from −1 (path lived entirely below the origin) to +1 (entirely above). Agnear zero means a balanced, directionless window. - Volatility measurement: An average true range (ATR) is computed in-line from raw bars — no external indicator — and normalised by price (
atr / close). This "normalised volatility" is tracked against its own recent average. - Self-adapting dominance band: The base
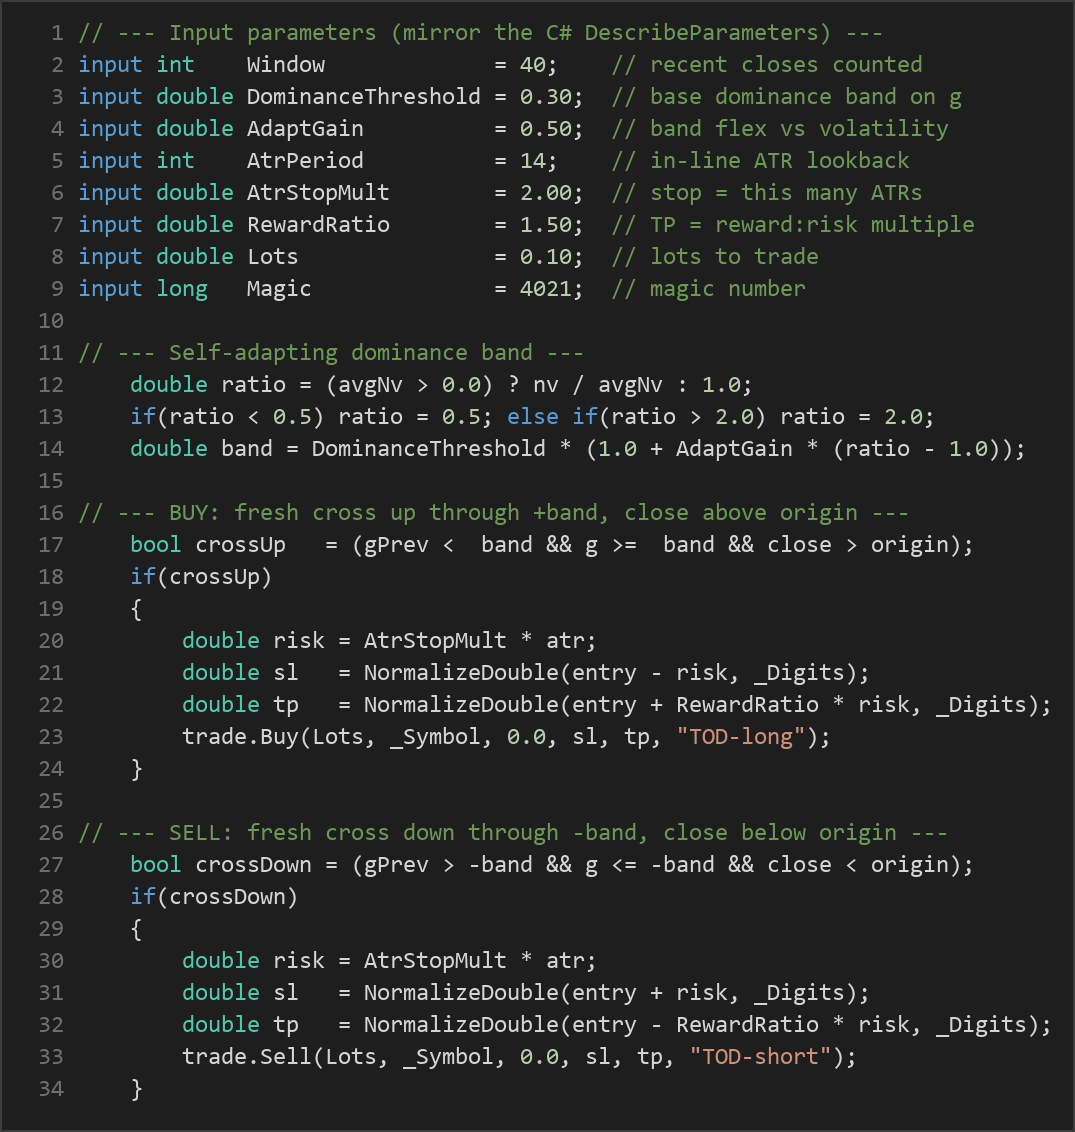
DominanceThresholdis widened when volatility runs hot relative to its recent norm and narrowed when the tape is calm, scaled byAdaptGain. Noisier conditions therefore demand stronger consensus before a signal fires.
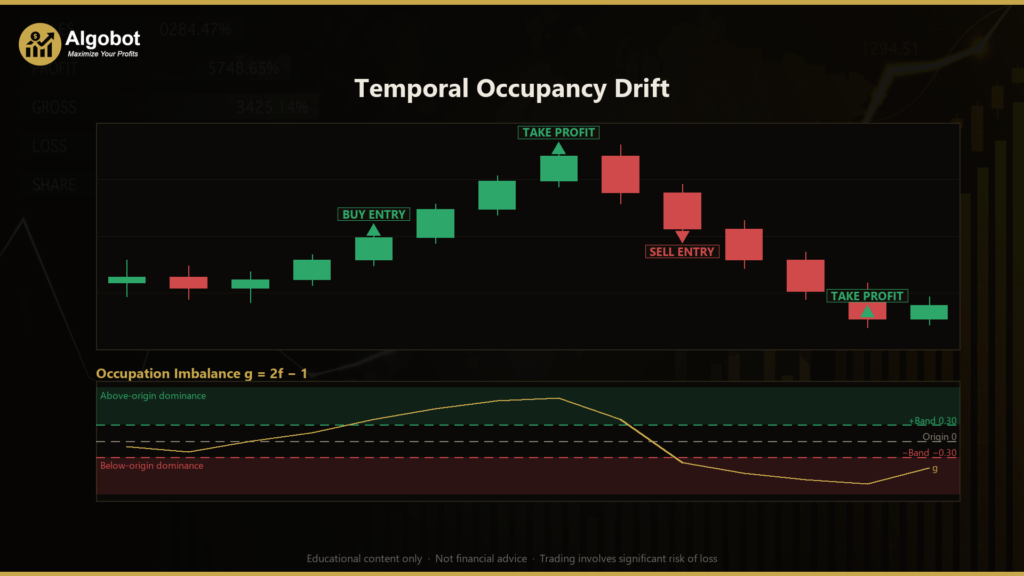
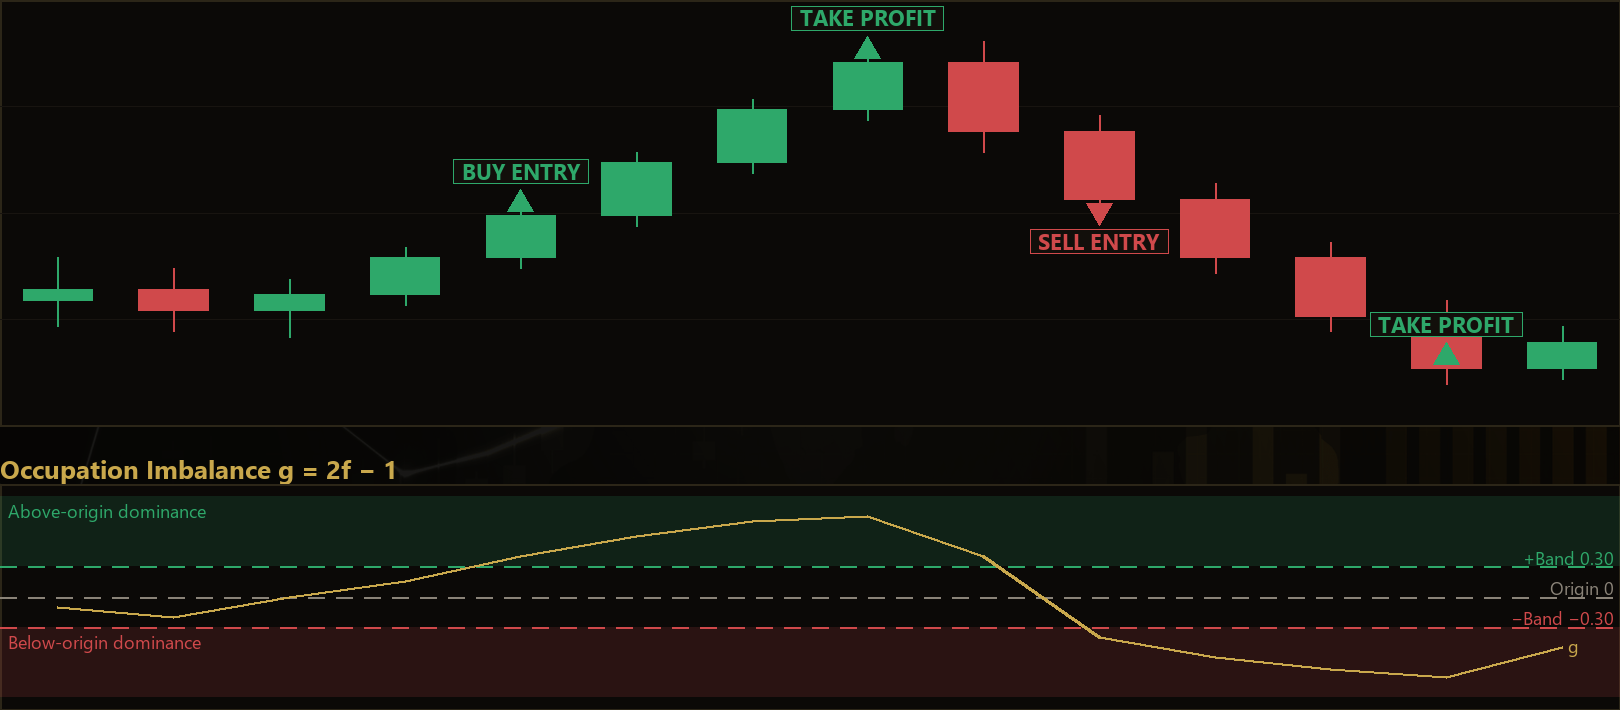
Entry conditions require a fresh cross of the band, not merely a state — this avoids chasing moves that are already mature:
- The strategy signals a long when
gcrosses up through the positive band (the previous bar was below it, the current bar is at or above it) and the current close is above the origin. - The strategy signals a short when
gcrosses down through the negative band and the current close is below the origin.
Exit logic works on three fronts:
- Dynamic regime exit: If an open position's imbalance flips back through zero (a long while
gturns negative, or a short whilegturns positive), the strategy closes the trade immediately — releasing the bet the moment the regime it was riding dissolves. - Stop-loss: Placed
AtrStopMultATRs away from entry, so the risk distance breathes with volatility. - Take-profit: Set at
RewardRatiotimes the stop distance, keeping a consistent reward-to-risk shape.
Only one position is held at a time; the strategy lets risk resolve before considering a new entry.
Strategy Parameters
| Parameter | Default | Min | Max | Description |
|---|---|---|---|---|
| Window | 40 | 10 | 120 | Number of recent closes whose "which side of the origin" votes are counted to form the occupation fraction. |
| DominanceThreshold | 0.30 | 0.10 | 0.60 | Base dominance band on the centred imbalance g (range −1 to +1); a fresh cross of this band fires an entry. |
| AdaptGain | 0.50 | 0.00 | 2.00 | How strongly the band flexes with normalised volatility relative to its own recent mean. Higher values demand stronger consensus in noisy markets. |
| AtrPeriod | 14 | 5 | 40 | Lookback length for the in-line average true range used for risk sizing and the volatility filter. |
| AtrStopMult | 2.00 | 0.50 | 5.00 | Stop-loss distance expressed as this many ATRs from the entry price. |
| RewardRatio | 1.50 | 0.50 | 4.00 | Take-profit distance as a reward-to-risk multiple of the stop distance. |
| Lots | 0.10 | 0.01 | 1.00 | Fixed position size, in lots, for each trade. |
Recommended Chart Settings
Temporal Occupancy Drift is a single-timeframe strategy — every calculation uses the chart's own symbol and period, so no multi-timeframe setup is needed. A practical starting point for study is a liquid major forex pair such as EUR/USD on a mid-range timeframe like H1 (1-hour), where the default Window of 40 bars spans a meaningful stretch of market activity and ATR-based sizing has room to breathe.
That said, the occupation concept is timeframe-agnostic, and behaviour will vary considerably across instruments and periods. Faster charts produce more frequent crosses and noisier signals; slower charts produce fewer, slower-developing regimes. Always confirm on your own data that the Window length and volatility band suit the instrument you intend to study, and remember that results will differ across changing market conditions.
How to Install on MetaTrader 5
- Download the .ex5 file from the link below.
- Copy it to your MT5
MQL5\Expertsfolder. - Restart MetaTrader 5 or refresh the Navigator panel.
- Drag the EA onto a chart matching the recommended symbol and timeframe.
- Configure the input parameters and enable Algo Trading.
What to Consider Before Using This EA
The main strength of Temporal Occupancy Drift is its low-lag, aggregated read on direction. Because occupation counts many binary "which side" votes across the whole window, a single noisy bar cannot flip the signal — it is a low-variance regime estimate that remains responsive because it works on unsmoothed count data rather than a lagging moving average. Trading the emergence of dominance (the band cross) instead of an already-established state is a thoughtful attempt to enter before a move is fully mature, and the volatility-adaptive band is a genuine effort to demand more evidence when the tape is choppy.
There are, however, real limitations. The underlying arcsine intuition describes driftless random walks; live markets have drift, microstructure, spreads, and news shocks that no clean theorem captures. In ranging or choppy markets, the imbalance can cross the band, trigger an entry, and then flip back through the origin quickly — producing whipsaw exits and a string of small losses. The single-position rule means the strategy can sit idle through opportunities while one trade resolves. And like any parameter-driven system, it is vulnerable to over-fitting: tuning Window, the band, and ATR settings until a backtest looks flattering rarely survives contact with unseen data. Treat every default as a starting point for research, not a validated edge.
Risk Management Tips
Sound risk management matters more than any single signal. Consider these general principles as you study this EA:
- Risk a small, fixed fraction per trade. Many educators suggest risking no more than 1–2% of account equity on any one position. Size your
Lotsso that the ATR-based stop distance corresponds to that fraction, rather than trading a large fixed lot. - Test on a demo account first. Run the strategy on a demo or paper account across varied market conditions before committing real capital, so you understand its behaviour and typical drawdown.
- Understand drawdown. Even a logically sound strategy will experience losing streaks. Know the maximum peak-to-trough decline you are prepared to tolerate, and decide your response in advance.
- Account for costs. Spreads, commissions, and slippage erode results, especially on faster timeframes where signals are frequent.
- Never over-leverage. Leverage amplifies losses as readily as gains; keep position sizes conservative relative to your account.
Risk Warning
Trading foreign exchange, CFDs, and other leveraged financial instruments involves substantial risk of loss and is not suitable for all investors. The strategies and tools discussed on this page are provided for educational purposes only and do not constitute financial advice, investment recommendations, or solicitation to trade. Always consult a qualified financial adviser before making trading decisions. Past backtest performance is not indicative of future results.
Downloads
- Expert Advisor: TemporalOccupancyDrift.ex5 (61 downloads)
- Source Code: TemporalOccupancyDrift.mq5 (62 downloads)
- Documentation: TemporalOccupancyDrift.pdf (68 downloads)