Disclaimer: This article is for educational and informational purposes only. It does not constitute financial or investment advice. Trading forex and CFDs carries significant risk of loss. Past performance of any strategy — including backtests — does not guarantee future results. Never trade with money you cannot afford to lose.
What Is This Strategy?
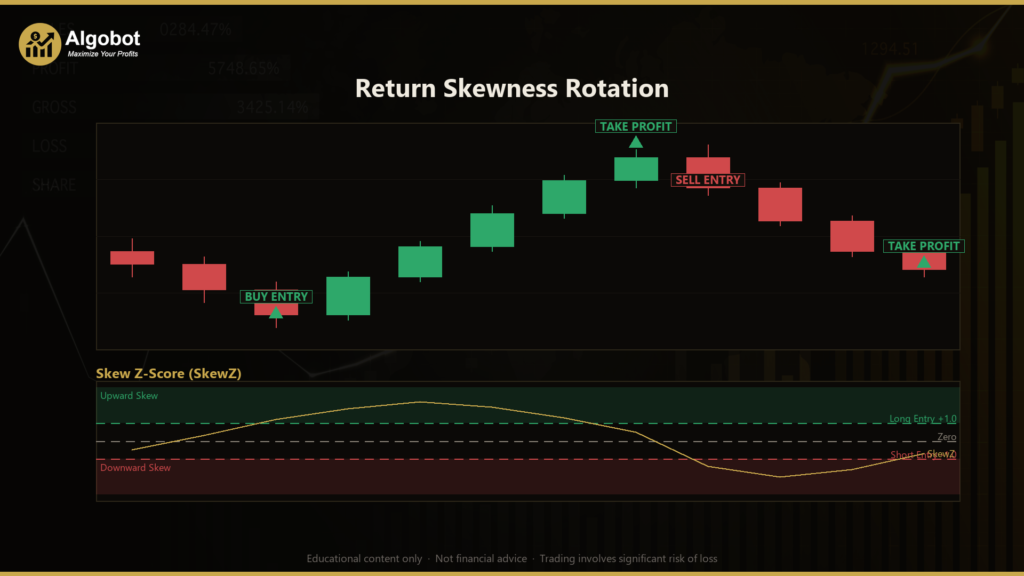
Return Skewness Rotation is a statistical, mean-relative trading strategy for MetaTrader 5 built around skewness — the third statistical moment of a distribution, which measures how lopsided a set of returns is. Instead of watching price, a moving average, or an oscillator, this Expert Advisor (EA) watches the shape of recent price returns and looks for moments when that shape becomes asymmetric in one direction. The trading style is best described as short-term, signal-driven rotation: the EA enters when directional asymmetry "rotates in" and exits when it neutralizes.
The core hypothesis is a first-principles idea from market microstructure. Near a genuine shift in direction, one side of the market often absorbs a cluster of small opposing moves (the "body" of the return distribution) while releasing pressure in occasional larger bursts (the "tail"). That imbalance shows up as skewness in the return series before it becomes visible as a trend or momentum in the average price. In other words, the strategy tries to read latent pressure in the distribution before it turns into obvious drift.
As a learning tool, Return Skewness Rotation is well suited to traders who want to move beyond conventional indicators and study how statistical properties of returns can be turned into trade signals. It is a good candidate for anyone curious about z-scores, rolling distributions, and regime-relative thresholds. It is not a "set and forget" system, and it should be treated as a framework for analysis and experimentation rather than a finished product.
How It Works
The strategy acts once per completed bar. On each new bar, it updates its rolling data series, recalculates the skewness signal, standardizes it, and then checks its exit and entry rules. Here is the logic in plain English:
- Build the return series. For each completed bar, the EA calculates the log-return (the natural logarithm of the current close divided by the previous close). Log-returns are used because they are additive and comparable across price levels.
- Measure skewness. Over the most recent
SkewWindowlog-returns, the strategy computes the population skewnessg = m3 / s³. A positive value means the return distribution leans toward upside surprises; a negative value means it leans toward the downside. - Standardize the signal (the "z-score"). Raw skewness varies by symbol, timeframe, and market regime, so a fixed threshold would be meaningless. Instead, the strategy standardizes the latest skew reading against its own recent history:
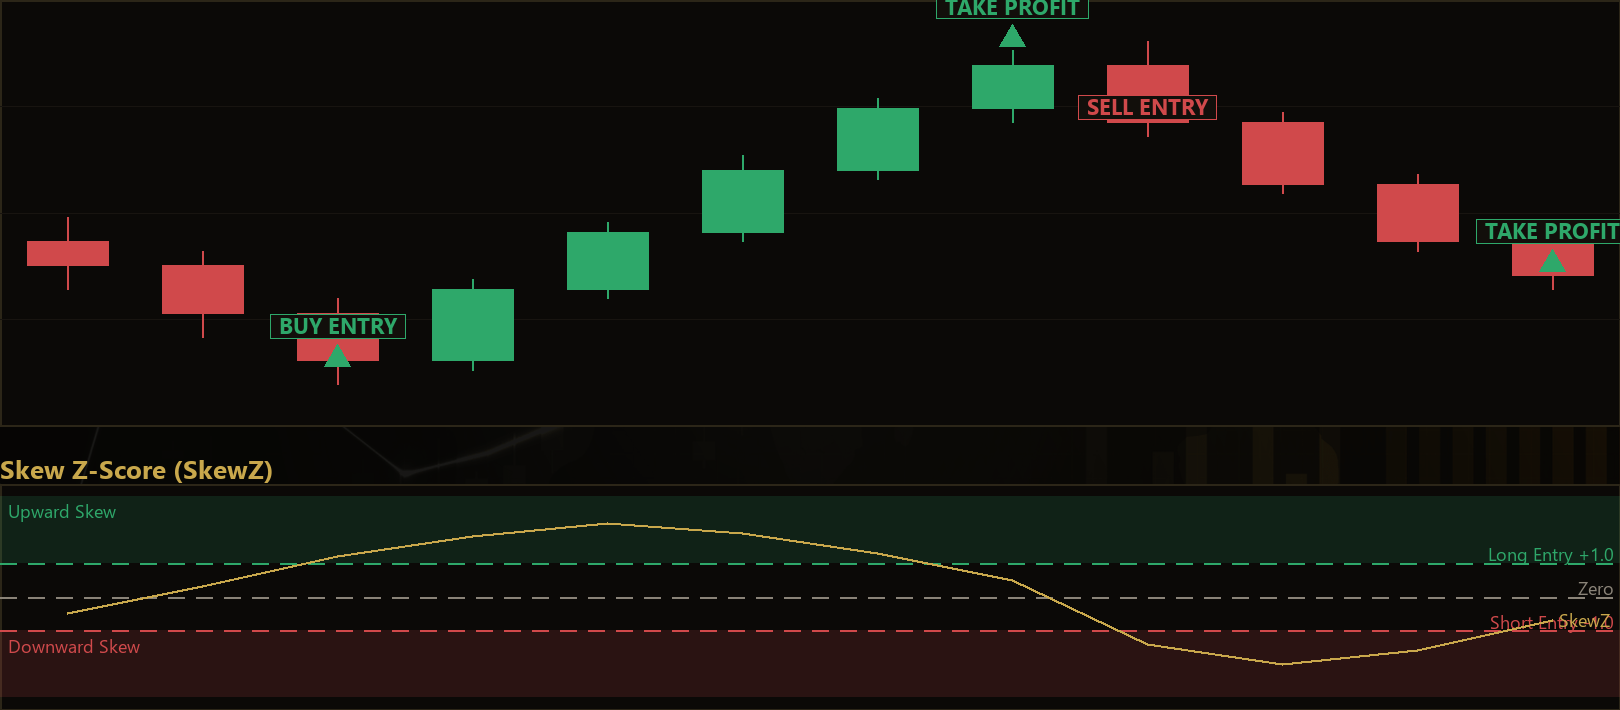
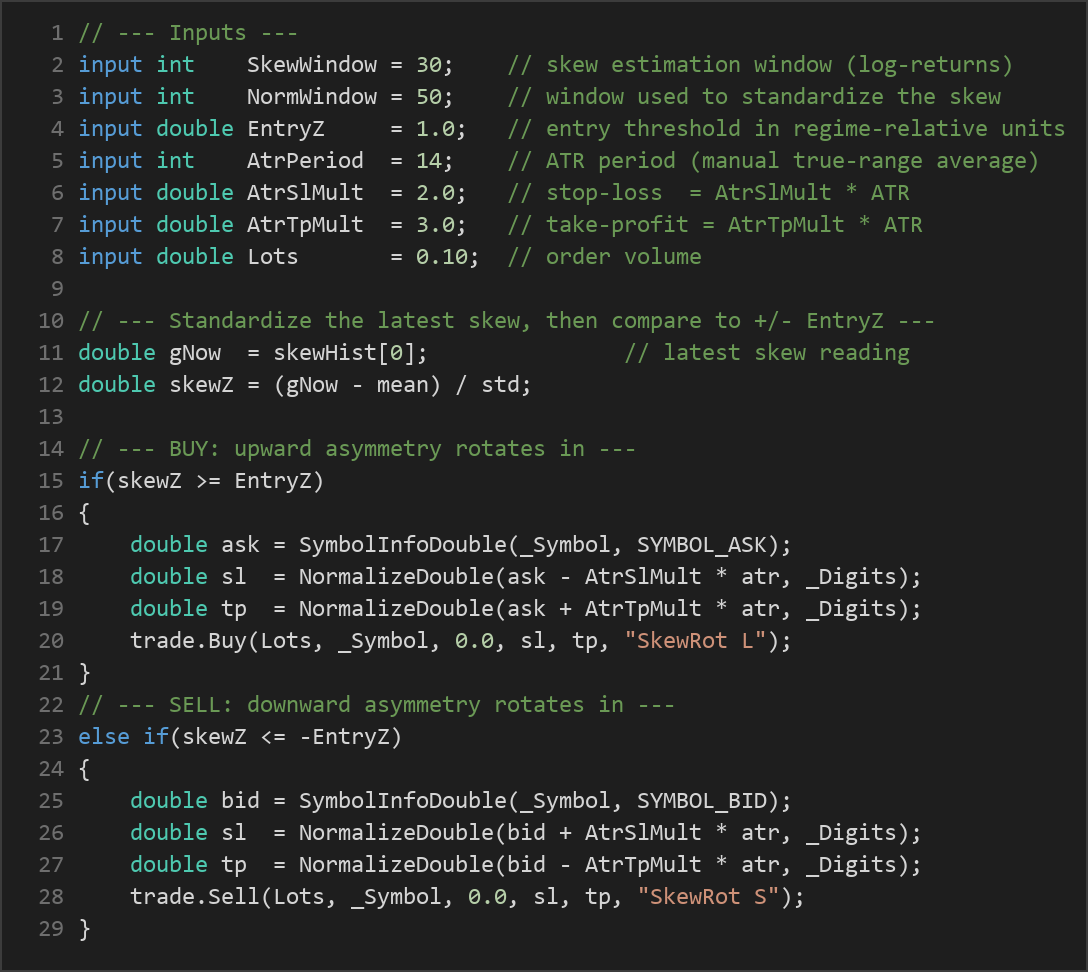
SkewZ = (g − mean_g) / std_g, measured over the lastNormWindowskew readings. This expresses the signal in regime-relative units, so a reading of "1.0" means roughly one standard deviation above the recent norm — regardless of the instrument. - Long entry. When the strategy is flat, it signals a buy if
SkewZ >= EntryZ— upward asymmetry has rotated in strongly enough relative to its recent range. - Short entry. When flat, it signals a sell if
SkewZ <= -EntryZ— downward asymmetry has rotated in. - Dynamic exit. The strategy closes an open long when
SkewZfalls back below zero, and closes an open short whenSkewZrises back above zero. The idea is that once the asymmetry is neutralized, the reason for the trade no longer holds. - Stop-loss. On every entry, the stop is placed at
AtrSlMult × ATRaway from the entry price — below the ask for longs, above the bid for shorts. - Take-profit. The target is placed at
AtrTpMult × ATRin the trade's direction. - Volatility measure. The ATR (Average True Range) here is computed manually as a simple average of true range over the newest
AtrPeriodbars, so the stop and target scale with current volatility rather than fixed pip distances. Note this is a simple average, not the Wilder-smoothed ATR of the built-in indicator. - One position per magic. The EA holds at most one position at a time (tracked by its magic number), so signals do not stack.
Strategy Parameters
| Parameter | Default | Min | Max | Description |
|---|---|---|---|---|
| SkewWindow | 30 | 15 | 80 | Number of recent log-returns used to estimate skewness. Larger values smooth the signal but react more slowly. |
| NormWindow | 50 | 20 | 150 | Number of past skew readings used to standardize the current skew into a z-score (its "regime" baseline). |
| EntryZ | 1.0 | 0.3 | 2.5 | Entry threshold in regime-relative (standard-deviation) units. Higher values demand stronger asymmetry before trading. |
| AtrPeriod | 14 | 7 | 30 | Number of bars used in the manual ATR (true-range average) that sizes the stop and target. |
| AtrSlMult | 2.0 | 0.5 | 5.0 | Stop-loss distance as a multiple of ATR. Larger values give the trade more room but risk more per trade. |
| AtrTpMult | 3.0 | 0.5 | 6.0 | Take-profit distance as a multiple of ATR. Sets the reward side of the risk/reward ratio. |
| Lots | 0.10 | 0.01 | 1.0 | Fixed order volume (position size) in lots. |
Recommended Chart Settings
Return Skewness Rotation is symbol- and timeframe-agnostic by design, because the z-score standardization adapts the thresholds to whatever instrument and timeframe you run it on. That said, it needs a meaningful sample of bars before it produces a signal: with the defaults it requires roughly SkewWindow + NormWindow completed bars (about 80) of history before the first trade can occur, so an intraday timeframe such as M15 or H1 on a liquid major FX pair (for example EUR/USD) is a sensible starting point for study. Higher timeframes will produce fewer, slower signals; lower timeframes will produce more, noisier ones. Results will vary substantially across different symbols, timeframes, and market conditions, so treat any single configuration as one experiment among many.
How to Install on MetaTrader 5
- Download the .ex5 file from the link below
- Copy it to your MT5
MQL5\Expertsfolder - Restart MetaTrader 5 or refresh the Navigator panel
- Drag the EA onto a chart matching the recommended symbol and timeframe
- Configure the input parameters and enable Algo Trading
What to Consider Before Using This EA
Return Skewness Rotation has some genuinely interesting properties, but it also has clear limitations that you should understand before relying on it.
Strengths. The signal is self-adapting: because entries are expressed in z-score units rather than fixed levels, the same parameter set can be applied across different symbols and timeframes without manual re-tuning. Skewness is also a different information source from the price-based indicators most retail systems use, so it may capture pressure that momentum tools miss. Finally, the ATR-based stop and target mean that risk distances automatically scale with current volatility.
Limitations. Skewness estimated from a small window is statistically noisy — a handful of outlier bars can swing the reading — so signals can be choppy, especially on lower timeframes. The strategy is essentially a short-term rotation model; in strongly trending markets it may exit early when skew rotates back through zero, and in quiet, directionless conditions it can generate frequent whipsaw trades. The manual ATR is a simple average rather than the smoother Wilder ATR, so stop distances can shift more abruptly. And like any single-position, single-signal system, it has no built-in protection against gaps, news spikes, or extended drawdowns. Historically, statistical edges like this one can decay as market regimes change, so ongoing monitoring is essential.
Risk Management Tips
Sound risk management matters more than any single signal. Consider these general principles as you study this EA:
- Risk a small, fixed fraction per trade. Many educators suggest risking no more than 1–2% of account equity on any single position. Size your lots so that the ATR-based stop distance corresponds to that fraction, rather than leaving
Lotsat a default that may be too large for your account. - Test on a demo account first. Run the strategy on a demo or in the Strategy Tester for an extended period before considering any live capital. This lets you observe its behavior across different regimes without financial risk.
- Understand drawdown. Even a strategy with a sound premise will have losing streaks. Know the maximum drawdown you are willing to tolerate and how it maps to your position size.
- Diversify and avoid over-optimization. Fitting parameters too tightly to past data ("curve-fitting") tends to produce results that do not hold up going forward. Prefer parameter values that work reasonably across a range rather than one perfect-looking setting.
- Account for costs. Spreads, commissions, and slippage can materially affect a short-term rotation strategy that trades frequently. Include realistic costs in any testing.
Risk Warning
Trading foreign exchange, CFDs, and other leveraged financial instruments involves substantial risk of loss and is not suitable for all investors. The strategies and tools discussed on this page are provided for educational purposes only and do not constitute financial advice, investment recommendations, or solicitation to trade. Always consult a qualified financial adviser before making trading decisions. Past backtest performance is not indicative of future results.
Downloads
- Expert Advisor: ReturnSkewnessRotation.ex5 (42 downloads)
- Source Code: ReturnSkewnessRotation.mq5 (41 downloads)
- Documentation: ReturnSkewnessRotation.pdf (46 downloads)