Disclaimer: This article is for educational and informational purposes only. It does not constitute financial or investment advice. Trading forex and CFDs carries significant risk of loss. Past performance of any strategy — including backtests — does not guarantee future results. Never trade with money you cannot afford to lose.
What Is This Strategy?
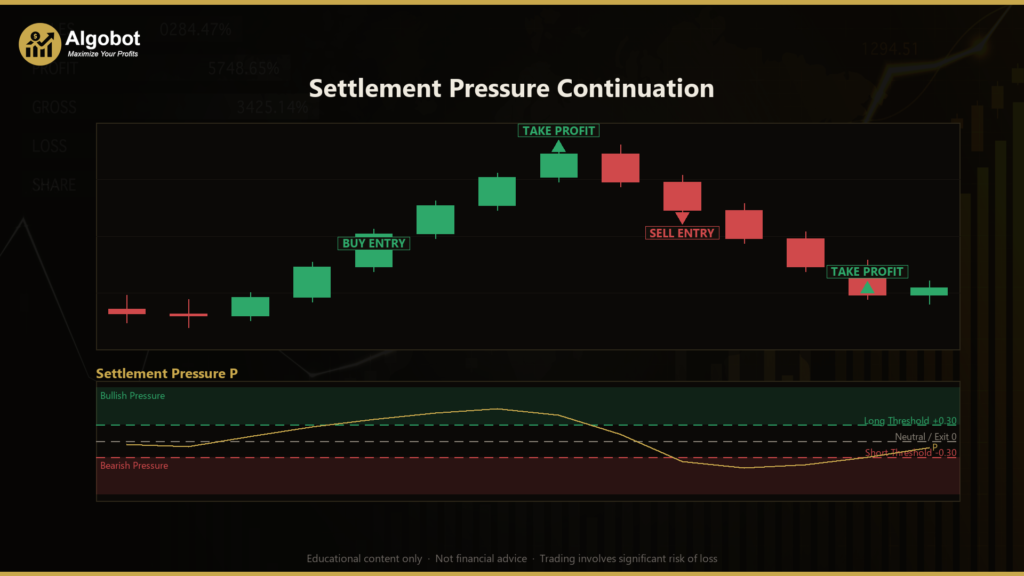
The Settlement Pressure Continuation strategy is a momentum-continuation trading system built entirely from raw price data — the open, high, low, and close (OHLC) of each candle — using a custom measure the author calls settlement pressure. Unlike conventional tools such as moving averages or oscillators that read close-to-close change, this approach studies where inside each bar's own range price chose to settle, and how much energy (range) the bar spent getting there. It is a trend-following, or "continuation," style system rather than a mean-reversion or scalping one.
The core idea is a hypothesis about order flow. When traders repeatedly force the close toward one extreme of wide, expanding candles, that behaviour may indicate a persistent imbalance between buyers and sellers — one that historically tends to continue for several bars before neutralising. A small-bodied candle that closes in the middle of its range (a "doji," a bar signalling indecision) carries little conviction and is weighted lightly; a wide bar that slams shut right at its high carries a lot. By energy-weighting each bar's settlement by its range, the strategy tries to distinguish genuine conviction from noise.
As a learning tool, Settlement Pressure Continuation is well suited to intermediate traders who want to understand how a signal can be engineered directly from OHLC geometry rather than borrowed from a published indicator. It is a good case study in first-principles system design, dynamic risk sizing, and rules-based entries and exits. It is not a shortcut to results, and — like any single-timeframe momentum system — it will behave very differently across calm and volatile market regimes.
How It Works
At the heart of the strategy is a single dimensionless number, the settlement pressure P, computed over the last Window closed bars:
`
Σ (2·Close − High − Low)
P = ────────────────────────── ∈ [−1, +1]
Σ (High − Low)
`
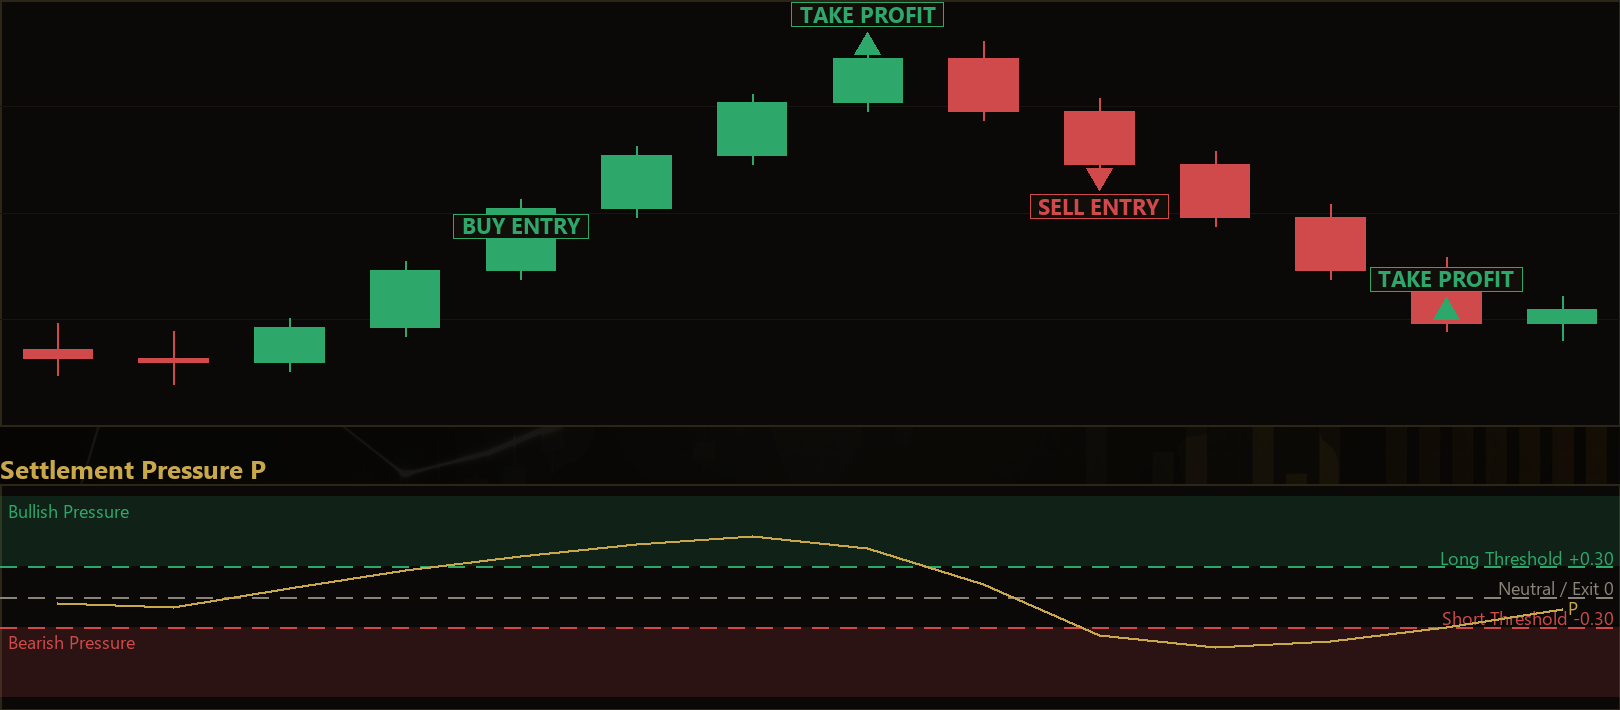
Intuitively, P measures net close-versus-midpoint displacement divided by total range traversed. A reading near +1 means closes are persistently pinned near the highs of wide bars (a bullish imbalance); near −1 is the mirror image (bearish); near 0 means balanced, indecisive settlement. Because the range weights cancel algebraically, P is a clean ratio, not a moving average of price.
Here is how the strategy uses P:
- The strategy signals a long entry when three conditions align:
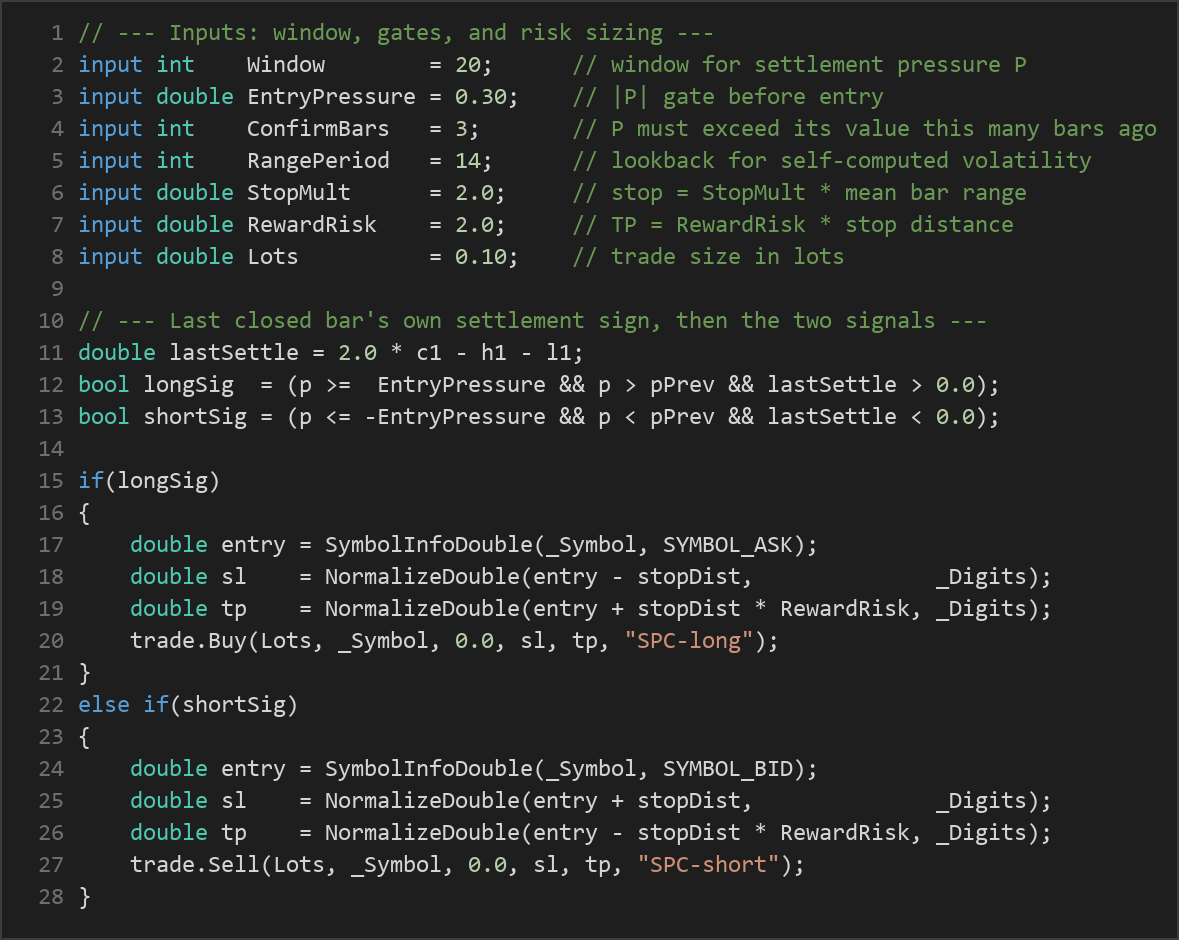
Pis at or above theEntryPressuregate (e.g. +0.30);Pis rising — more extreme than it wasConfirmBarsbars ago; and the most recently closed bar itself settled above its own midpoint (2·Close − High − Low > 0). The "rising versus a few bars ago" clause demands the imbalance be accelerating, not stale. - The strategy signals a short entry under the mirror conditions:
Pat or below −EntryPressure,Pfalling, and the last closed bar settled below its own midpoint. - Stop-loss logic is self-adapting. The strategy computes its own volatility as the mean raw bar range over
RangePeriodbars, then sets the stop distance toStopMult × mean range. The same rules therefore auto-size the stop in calm versus violent conditions, with no fixed pip value hardcoded. - Take-profit logic places the target at
RewardRisk × stop distanceaway from entry. With the defaults, that is a 2:1 reward-to-risk target. - Dynamic exit. Beyond the hard stop and target, the strategy closes an open position the instant
Pcrosses back through zero — that is, the moment the settlement edge that justified the trade has neutralised. This banks or cuts the trade early rather than waiting for a fixed level to be hit.
The system evaluates signals only once per newly closed bar (it reads the bar at shift 1, never the still-forming bar), which avoids repainting. It also holds at most one position at a time per magic number.
Strategy Parameters
| Parameter | Default | Min | Max | Description | ||
|---|---|---|---|---|---|---|
| Window | 20 | 8 | 40 | Number of closed bars used to compute the energy-weighted settlement pressure P. Larger values smooth the signal; smaller values react faster. |
||
| EntryPressure | 0.30 | 0.10 | 0.70 | Magnitude gate: ` | P | ` must reach this level before an entry is allowed. Higher values demand a stronger, cleaner imbalance. |
| ConfirmBars | 3 | 1 | 8 | Acceleration gate: P must be more extreme than it was this many bars ago, confirming the imbalance is building rather than fading. |
||
| RangePeriod | 14 | 5 | 40 | Lookback used for the self-computed volatility (mean raw bar range) that sizes the stop. | ||
| StopMult | 2.0 | 0.5 | 4.0 | Stop distance as a multiple of the mean bar range. Larger values give the trade more room but increase risk per trade. | ||
| RewardRisk | 2.0 | 0.5 | 5.0 | Take-profit distance as a multiple of the stop distance. A value of 2.0 targets a 2:1 reward-to-risk ratio. | ||
| Lots | 0.10 | 0.01 | 1.0 | Fixed trade size in lots. Should be set to match your account size and risk tolerance. |
Recommended Chart Settings
The strategy is deliberately symbol- and timeframe-agnostic — nothing is hardcoded to a particular market or period. Every calculation reads the primary timeframe of whatever chart the Expert Advisor (EA) is attached to, so you choose the timeframe at test time. This makes it a flexible object of study: you can attach it to a major forex pair such as EUR/USD on the H1 (one-hour) chart as a sensible starting point, then compare its behaviour on other symbols and timeframes.
Because settlement pressure is a continuation signal, the strategy tends to have more to work with on instruments and timeframes that produce sustained directional moves with expanding ranges, and less on tightly range-bound conditions. Results will vary substantially across different market conditions, and there is no single "correct" setting — part of the educational value is testing systematically and observing how the same rules respond to different regimes.
How to Install on MetaTrader 5
- Download the
.ex5file from the link below. - Copy it to your MT5
MQL5\Expertsfolder. - Restart MetaTrader 5 or refresh the Navigator panel.
- Drag the EA onto a chart matching the recommended symbol and timeframe.
- Configure the input parameters and enable Algo Trading.
If you prefer to inspect or modify the logic, the SettlementPressureContinuation.mq5 source can be opened in MetaEditor and compiled to produce your own .ex5.
What to Consider Before Using This EA
Strengths. The design is transparent and self-contained: it uses no black-box indicator, and every input has a clear geometric meaning. Its volatility-scaled stop is a genuine strength — the same rules auto-size risk across calm and violent markets, which is more robust than a fixed-pip stop. The dynamic zero-cross exit is also thoughtful, releasing a trade the moment its rationale disappears rather than clinging to a static target.
Known limitations. Continuation systems are, by nature, vulnerable to whipsaw in choppy, sideways markets, where P may oscillate around zero and generate entries that are quickly stopped out. The acceleration gate (ConfirmBars) helps filter stale signals but cannot eliminate false starts. Because only one position is held at a time, the strategy can also sit out extended favourable moves after an early zero-cross exit. And as a single-timeframe system with no higher-timeframe context, it has no awareness of the larger trend it may be trading against.
Where it may underperform. Expect weaker behaviour during low-volatility consolidation, around major news spikes that produce erratic ranges, and on illiquid instruments with wide spreads that erode the modest edge. Thorough forward testing on a demo account across several market conditions is essential before drawing any conclusions.
Risk Management Tips
Sound risk management matters more than any single entry rule. As a general educational framework:
- Risk a small, fixed fraction per trade. Many educators suggest never risking more than 1–2% of account equity on a single position. Set your
LotsandStopMultso that a full stop-out stays within that limit. - Understand drawdown. Even a well-designed strategy will string together losing trades. Know the maximum losing streak you could tolerate — financially and emotionally — before committing real capital.
- Test on a demo account first. Run the EA in a risk-free simulated environment long enough to see it trade through different conditions before considering live use.
- Size positions to the account, not the signal. A strong
Preading does not justify a larger lot; position size should follow your account and risk rules, not your conviction. - Keep expectations grounded. No parameter set removes uncertainty. The goal of studying a system like this is to learn how rules translate into behaviour, not to eliminate risk.
Risk Warning
Trading foreign exchange, CFDs, and other leveraged financial instruments involves substantial risk of loss and is not suitable for all investors. The strategies and tools discussed on this page are provided for educational purposes only and do not constitute financial advice, investment recommendations, or solicitation to trade. Always consult a qualified financial adviser before making trading decisions. Past backtest performance is not indicative of future results.
Downloads
- Expert Advisor: SettlementPressureContinuation.ex5 (42 downloads)
- Source Code: SettlementPressureContinuation.mq5 (49 downloads)
- Documentation: SettlementPressureContinuation.pdf (44 downloads)