Disclaimer: This article is for educational and informational purposes only. It does not constitute financial or investment advice. Trading forex and CFDs carries significant risk of loss. Past performance of any strategy — including backtests — does not guarantee future results. Never trade with money you cannot afford to lose.
What Is This Strategy?
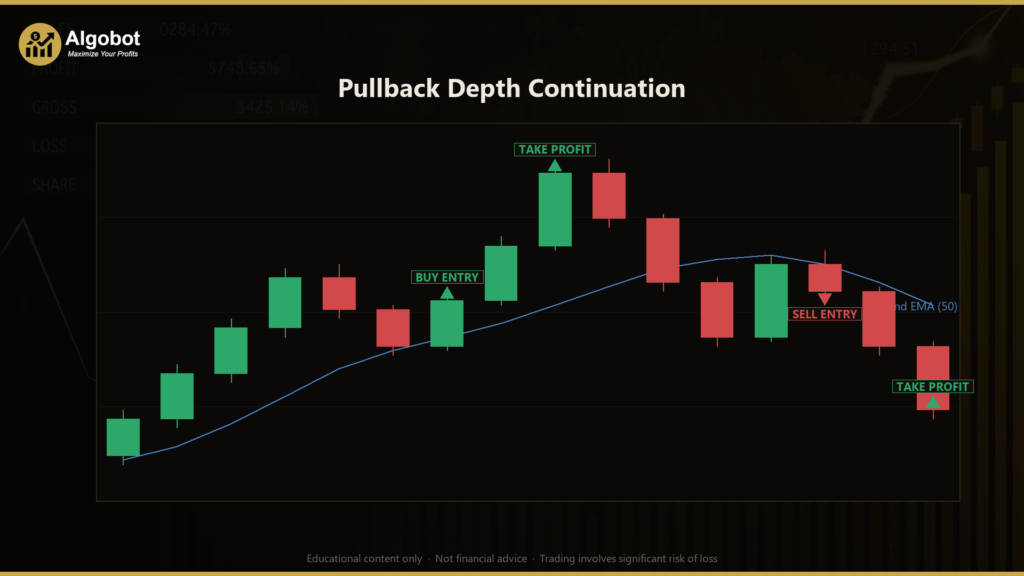
The Pullback Depth Continuation strategy is a trend-following expert advisor (EA) that combines an Exponential Moving Average (EMA) trend filter with an Average True Range (ATR) based measurement of retracement depth. In plain terms, it is built around a very old market idea — "buy the dip in an uptrend, sell the rally in a downtrend" — but it tries to qualify each dip using a measured, volatility-normalised distance rather than a traditional oscillator like RSI or Stochastic. An EMA is a moving average that gives more weight to recent prices, so it reacts faster than a simple average; ATR is a measure of how much an instrument typically moves in a bar, which the strategy uses as a "ruler" for depth.
What makes this approach worth studying is how it defines a valid pullback. Instead of asking "is momentum oversold?", the Pullback Depth Continuation logic asks "how far has price retraced from its recent swing extreme, expressed in ATRs?". A pullback that is too shallow may just be noise; a pullback that is too deep may mean the trend has already broken. The strategy only arms a setup when the retracement falls inside a defined "value band" — deep enough to be a real dip, shallow enough that the trend is likely intact.
As a learning tool, this EA is well suited to traders who want to understand trend-continuation mechanics, volatility normalisation, and structured entry qualification. It is a strategy analysis framework, not a shortcut — the value here is in seeing how regime filtering, depth measurement, and disciplined exits fit together into a single, rule-based system that never takes counter-trend trades.
How It Works
The strategy evaluates its rules once per newly-closed bar on a single timeframe (the chart's own symbol and period). It moves through three logical gates before it will consider an entry, and it manages open trades with three separate exit mechanisms.
Trend regime filter (the gate):
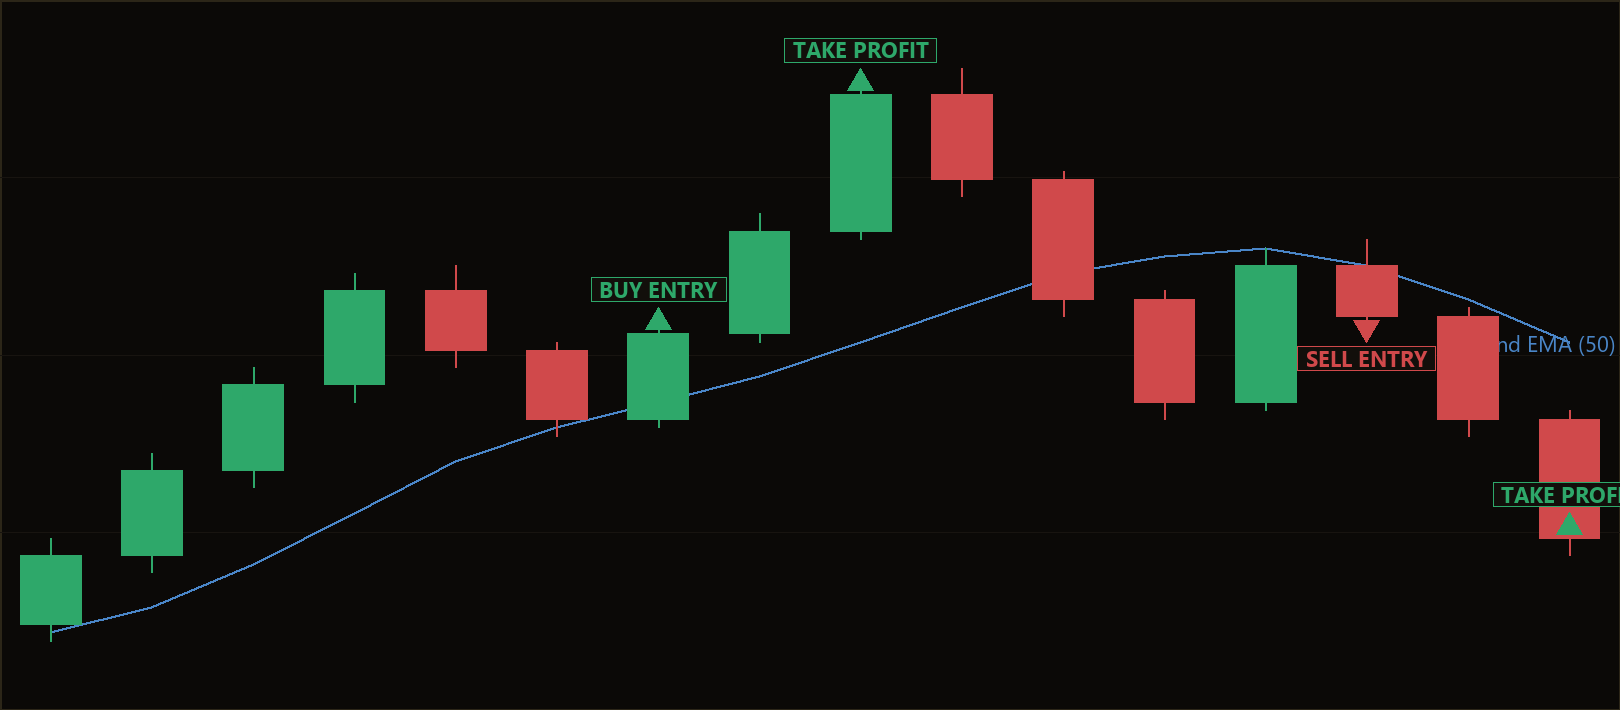
- The strategy calculates a trend-defining EMA and checks its slope over a lookback window. The EMA must be rising for longs and falling for shorts.
- For a long setup, the most recent close must be above a rising EMA. For a short setup, the close must be below a falling EMA.
- If neither condition is true, no trade is considered — the strategy signals no setup and simply waits. It never trades against the prevailing trend.
Pullback depth qualification (the value band):
- The strategy scans the recent bars for the swing extreme — the highest high (for longs) or lowest low (for shorts) over the pullback lookback window.
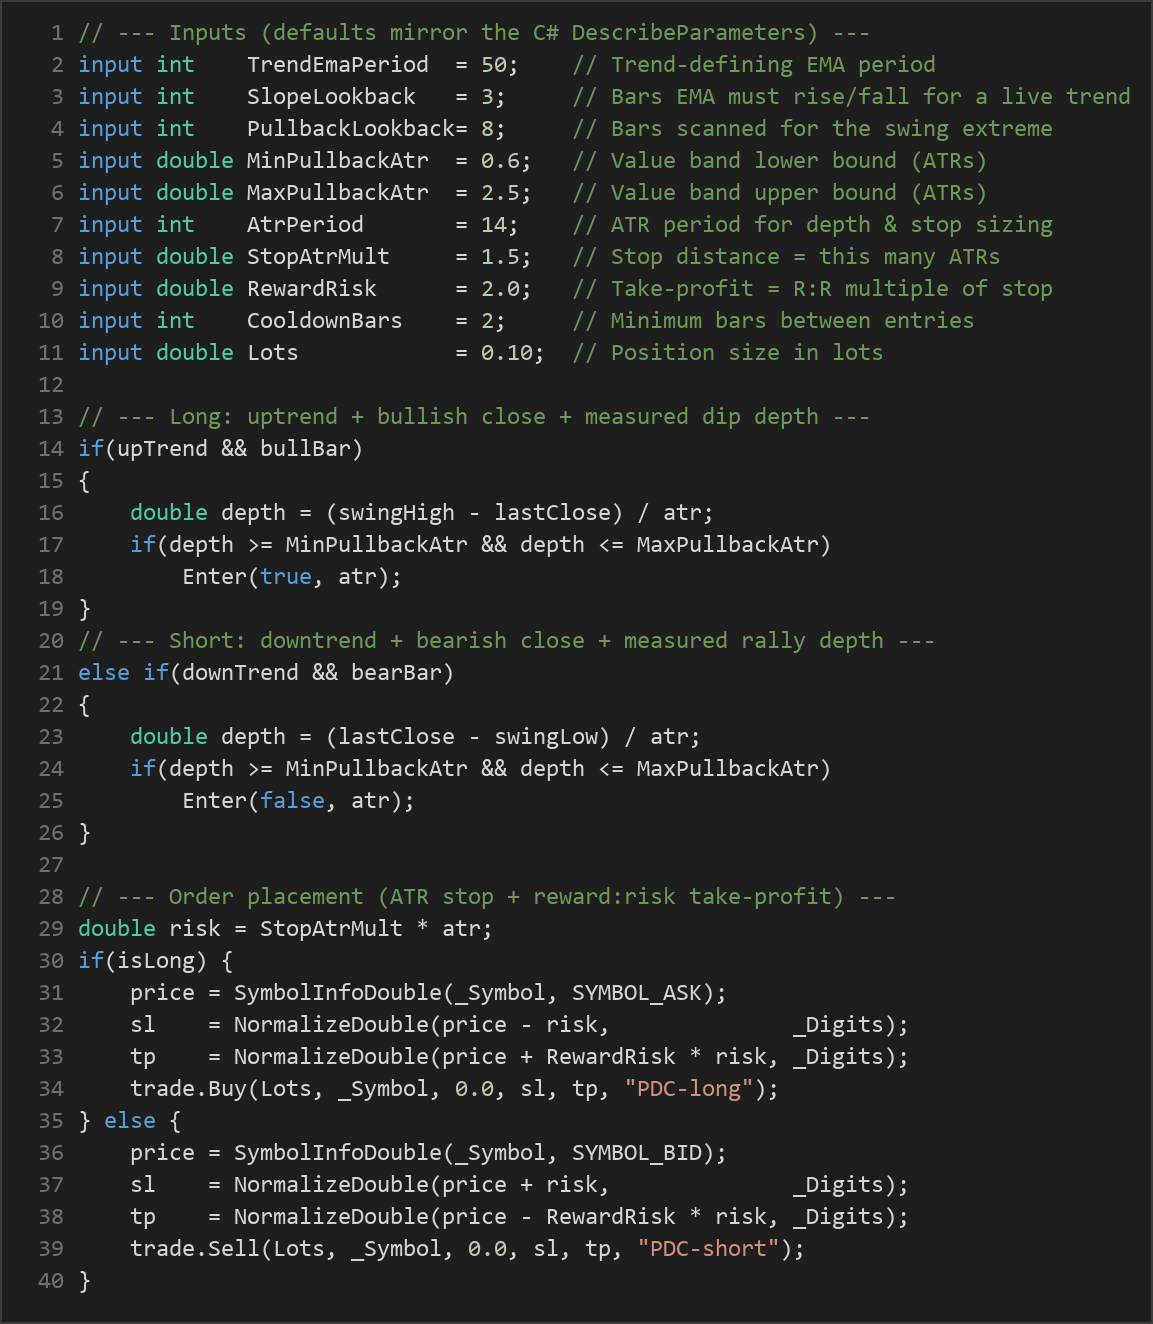
- It then measures how far price has retraced from that extreme and divides the distance by the current ATR, giving a depth reading in "ATRs".
- Only if that depth sits inside the
[MinPullbackAtr, MaxPullbackAtr]band does the setup remain valid. A dip that is shallower than the minimum, or deeper than the maximum, is skipped. Because the depth is normalised by ATR, the same rule behaves consistently in both calm and volatile conditions.
Resumption trigger (the timing):
- The setup only fires when the just-closed bar prints in the trend's direction — a bullish close (close above open) for longs, a bearish close for shorts.
- This is intended to signal that the pullback may be ending and the trend may be resuming, rather than entering while price is still falling into the dip.
Exit logic (three ways out):
- ATR stop-loss: the stop is placed a fixed number of ATRs away from entry (
StopAtrMult × ATR), so the risk distance adapts to current volatility. - Reward:risk take-profit: the profit target is set at a multiple of the stop distance (
RewardRisk × risk), so a 2.0 reward:risk aims for twice the risked distance. - Active trend-flip exit: if price closes back through the EMA against the position, the strategy treats the original premise as gone and closes the trade — even before the stop or target is hit.
Additional housekeeping rules keep the system disciplined: only one position per magic number is allowed at a time, and a cooldown of a set number of bars must pass between entries to dampen churn after a stop-out. Position size is fixed in lots.
Strategy Parameters
| Parameter | Default | Min | Max | Description |
|---|---|---|---|---|
| TrendEmaPeriod | 50 | 10 | 200 | Period of the trend-defining EMA. Larger values track a slower, longer-term trend. |
| SlopeLookback | 3 | 1 | 20 | Number of bars over which the EMA must have risen or fallen for the trend to count as live. |
| PullbackLookback | 8 | 3 | 30 | How many bars back the strategy scans for the swing extreme the pullback retraces from. |
| MinPullbackAtr | 0.6 | 0.0 | 3.0 | Lower bound of the value band (in ATRs): a valid dip must be at least this deep. |
| MaxPullbackAtr | 2.5 | 0.5 | 6.0 | Upper bound of the value band (in ATRs): deeper retracements are treated as a possible trend break and skipped. |
| AtrPeriod | 14 | 5 | 40 | ATR period used for depth normalisation and stop sizing. |
| StopAtrMult | 1.5 | 0.5 | 5.0 | Stop-loss distance expressed as this many ATRs from entry. |
| RewardRisk | 2.0 | 1.0 | 5.0 | Take-profit set as this reward:risk multiple of the stop distance. |
| CooldownBars | 2 | 0 | 30 | Minimum number of bars between entries, to reduce over-trading after a stop-out. |
| Lots | 0.10 | 0.01 | 1.0 | Fixed position size in lots. |
Recommended Chart Settings
The Pullback Depth Continuation EA is designed to run on a single timeframe — it reads every bar from the chart's own symbol and period, so the timeframe you attach it to is the timeframe it trades. Trend-continuation logic of this type is commonly studied on the H1 (1-hour) or H4 (4-hour) charts of liquid instruments such as major forex pairs (for example EUR/USD or GBP/USD), where trends tend to be cleaner and ATR readings more stable. Higher timeframes generally produce fewer but more deliberate signals.
Because the depth band and stop distances are all ATR-scaled, the strategy is intended to adapt across instruments of differing volatility. That said, every market behaves differently, and results will vary considerably across symbols, sessions, and market conditions. Always test any symbol/timeframe combination in the MT5 Strategy Tester and on a demo account before drawing conclusions.
How to Install on MetaTrader 5
- Download the .ex5 file from the link below
- Copy it to your MT5
MQL5\Expertsfolder - Restart MetaTrader 5 or refresh the Navigator panel
- Drag the EA onto a chart matching the recommended symbol and timeframe
- Configure the input parameters and enable Algo Trading
What to Consider Before Using This EA
Every rule-based strategy has a personality, and understanding it is more useful than judging it as "good" or "bad".
Strengths of this approach:
- Trend alignment. By requiring price to be on the correct side of a sloping EMA, the strategy avoids counter-trend entries, which are a common source of frustration for discretionary dip-buyers.
- Volatility normalisation. Measuring pullback depth in ATRs means the same rule adapts to calm and volatile regimes instead of using fixed pip distances that quickly become stale.
- Defined risk. Every trade has an ATR-based stop and a reward:risk target from the moment it opens, and the trend-flip exit provides a third, logic-based way out.
Known limitations:
- Trend dependence. Like all trend-following systems, this strategy may underperform in choppy, range-bound, or sideways markets where the EMA slope flip-flops and pullbacks rarely resolve into clean continuations.
- Whipsaw risk. The active trend-flip exit can close a trade on a single close back through the EMA, which protects against reversals but can also exit prematurely during noisy consolidation.
- Parameter sensitivity. The value band, EMA period, and lookback windows interact. Settings that historically suited one instrument may not transfer to another, and over-fitting to past data is a real danger.
- Fixed lot sizing. The default risk model uses a fixed lot size rather than sizing to a percentage of equity, so risk per trade in currency terms varies with the ATR-based stop distance.
The honest takeaway: this is a structured, educational example of trend-continuation logic. It may indicate promising conditions in trending markets, but it is not a solution to every environment, and no single parameter set will perform equally everywhere.
Risk Management Tips
Sound risk management matters more than any single entry rule. As you study this strategy, keep these general principles in mind:
- Risk a small, fixed fraction per trade. Many educational sources suggest risking no more than 1–2% of account equity on any single position, so a string of losses cannot end your account.
- Size positions deliberately. Because this EA uses a fixed lot size, take time to understand what that lot size means in currency risk given the ATR-based stop distance on your chosen instrument.
- Test on a demo account first. Run the strategy in the MT5 Strategy Tester and on a demo account across different market conditions before considering any live use.
- Understand drawdown. Even a well-behaved trend system will endure losing streaks and equity dips. Know the historical drawdown you are comfortable with and how it feels in practice.
- Never trade money you cannot afford to lose, and treat leverage with respect — it magnifies both gains and losses.
Risk Warning
Trading foreign exchange, CFDs, and other leveraged financial instruments involves substantial risk of loss and is not suitable for all investors. The strategies and tools discussed on this page are provided for educational purposes only and do not constitute financial advice, investment recommendations, or solicitation to trade. Always consult a qualified financial adviser before making trading decisions. Past backtest performance is not indicative of future results.
Downloads
- Expert Advisor: PullbackDepthContinuation.ex5 (0 downloads)
- Source Code: PullbackDepthContinuation.mq5 (0 downloads)
- Documentation: PullbackDepthContinuation.pdf (0 downloads)