Disclaimer: This article is for educational and informational purposes only. It does not constitute financial or investment advice. Trading forex and CFDs carries significant risk of loss. Past performance of any strategy — including backtests — does not guarantee future results. Never trade with money you cannot afford to lose.
What Is This Strategy?
The Ichimoku Baseline Breakout is a rule-based, trend-following strategy built around the Ichimoku Kinko Hyo indicator — a Japanese charting system that plots several averaged lines and a shaded "cloud" (the Kumo) to show trend direction, momentum, and support/resistance at a glance. Rather than trading every wiggle of price, this strategy waits for the market to first establish a clear trend using the cloud, and then looks for a specific pullback-and-resume pattern around the Ichimoku baseline (the Kijun-sen). It is a pure price-structure system: every line it uses is derived from bar highs and lows only, with no closing-price moving averages involved.
The strategy is designed for trending market conditions — periods where price is moving persistently in one direction rather than chopping sideways. When price sits cleanly above the cloud, the system only looks for long (buy) opportunities; when price sits below the cloud, it only looks for short (sell) opportunities. This "trade with the cloud" filter is what keeps the approach on the side of the dominant trend and helps it avoid fighting the prevailing move.
As a learning tool, the Ichimoku Baseline Breakout is well suited to traders who want to understand how the classic Ichimoku components fit together into a complete, mechanical trading plan — entry, exit, stop-loss, and take-profit all defined by rules. It is not a "set and forget" money machine, and it is not intended to be traded blindly. Think of it as a clean, transparent example of how a disciplined trend system is structured and how each condition contributes to the overall logic.
How It Works
The strategy evaluates its rules once per completed bar (candle) on a single timeframe. It first computes the core Ichimoku pieces, then checks whether a valid setup exists.
The Ichimoku building blocks:
- Tenkan-sen (Conversion Line): the midpoint — (highest high + lowest low) / 2 — of the last
TenkanPeriodbars. This is the faster, more reactive line. - Kijun-sen (Baseline): the midpoint of the last
KijunPeriodbars. This slower line acts as the strategy's key reference level, or "baseline." - Senkou Span A: the average of the Tenkan and Kijun, plotted forward (displaced) so the cloud sitting under price now was calculated some bars ago.
- Senkou Span B: the midpoint of the last
SenkouBPeriodbars, also displaced forward. The area between Span A and Span B forms the Kumo (cloud).
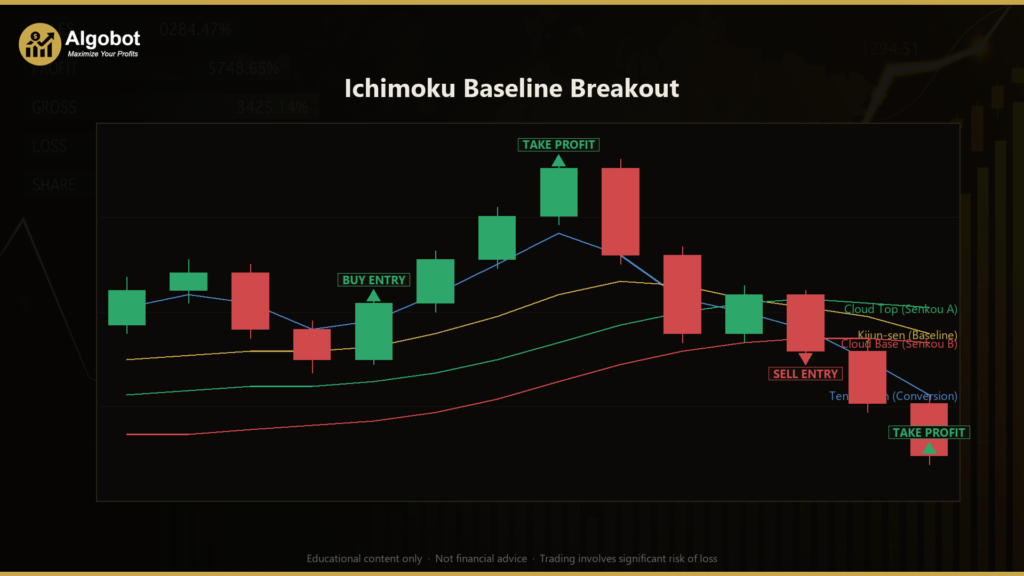
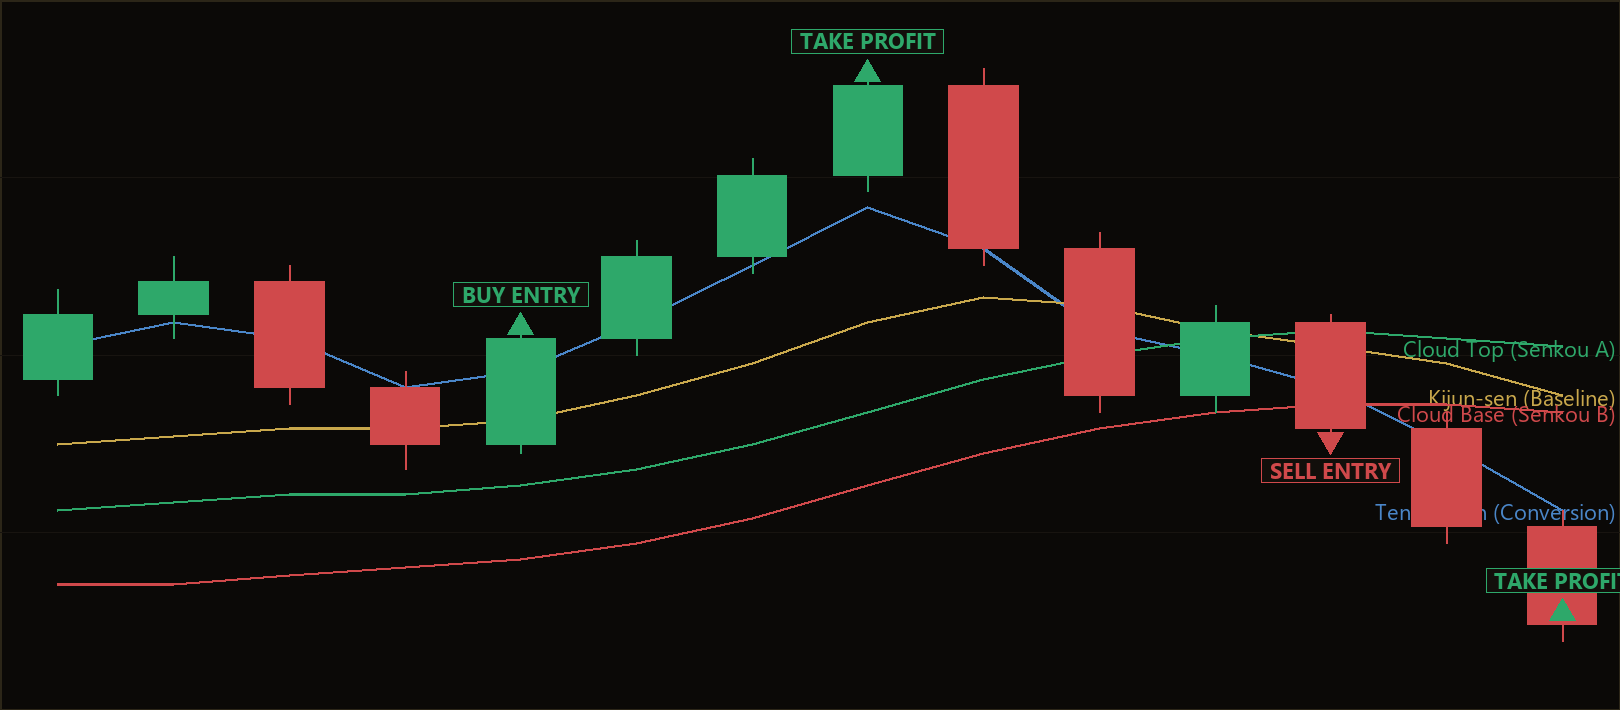
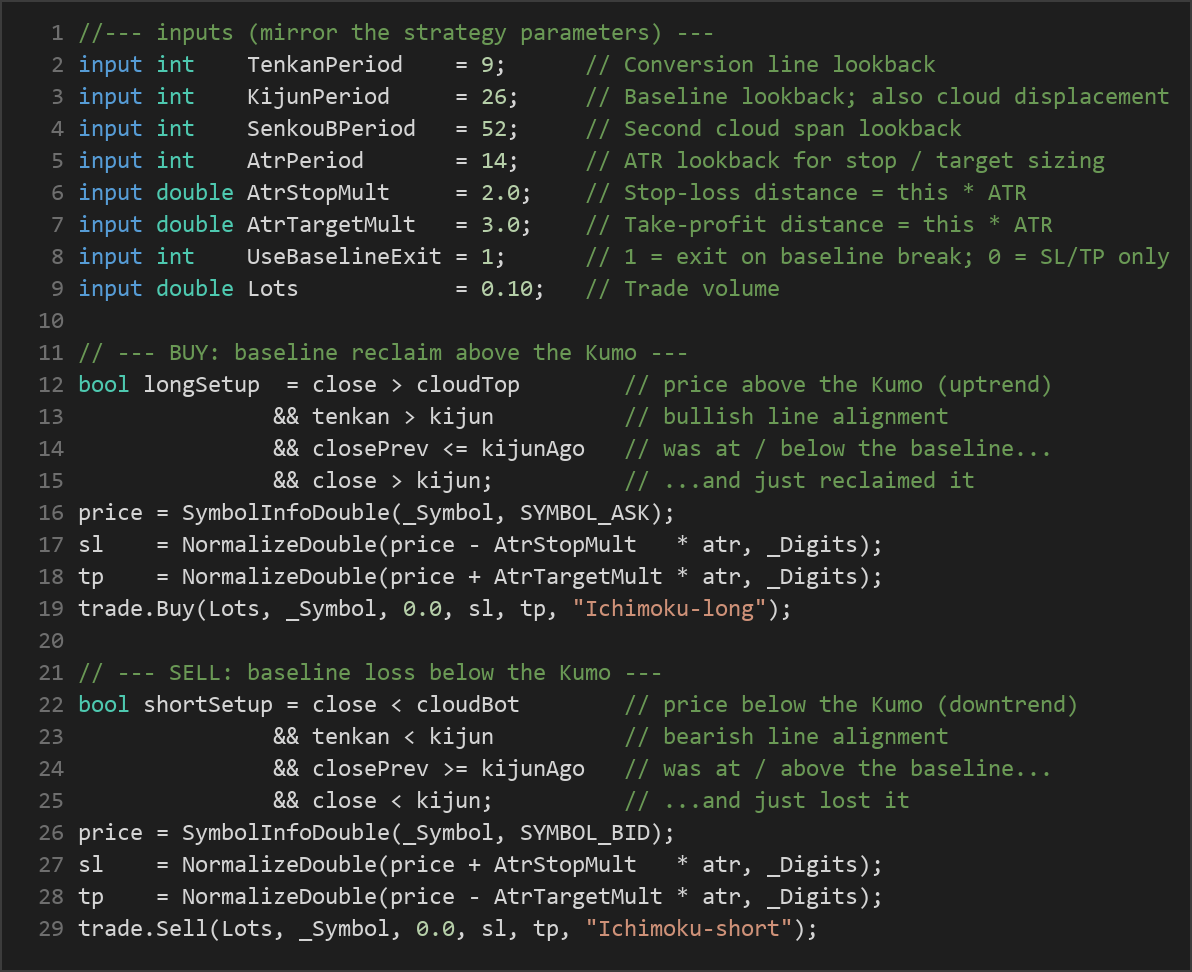
Entry conditions — the strategy signals a LONG when all of the following are true:
- Price closes above the cloud (close is greater than the cloud top) — indicating an established uptrend.
- The Tenkan-sen is above the Kijun-sen — confirming bullish alignment of the fast and slow lines.
- On the previous bar, price was at or below the baseline (a pullback toward the Kijun).
- On the just-closed bar, price reclaimed the baseline (closed back above the Kijun) — the pullback resumed in the trend's direction.
The strategy signals a SHORT under the exact mirror image: price below the cloud, Tenkan below Kijun, price previously at or above the baseline, and price closing back below it. In plain English, the system buys strength that dips to its baseline and resumes, and sells weakness that rallies to its baseline and rolls over — always in the cloud's direction.
Exit, stop-loss, and take-profit logic:
- Stop-loss: placed a distance of
AtrStopMult × ATRaway from entry. ATR (Average True Range) measures recent volatility, so the stop automatically adapts — wider in volatile markets, tighter in calm ones. - Take-profit: placed a distance of
AtrTargetMult × ATRin the profit direction. With the default settings (stop 2.0 × ATR, target 3.0 × ATR), the intended reward-to-risk ratio is roughly 1.5-to-1. - Optional baseline-break exit: when
UseBaselineExitis enabled, an open trade is closed early if price closes back through the Kijun against the position — the strategy reads this as the trend structure breaking down. - One position per Magic number: the strategy never stacks trades. While a position is open, it manages that trade only and will not add a new one.
Strategy Parameters
| Parameter | Default | Min | Max | Description |
|---|---|---|---|---|
| TenkanPeriod | 9 | 5 | 15 | Lookback (in bars) for the Tenkan-sen conversion line — the faster midpoint. |
| KijunPeriod | 26 | 15 | 40 | Lookback for the Kijun-sen baseline — the slower midpoint. Also sets the cloud's forward displacement. |
| SenkouBPeriod | 52 | 30 | 80 | Lookback for Senkou Span B — the widest cloud midpoint. |
| AtrPeriod | 14 | 7 | 30 | Lookback for the ATR used to size the stop-loss and take-profit. |
| AtrStopMult | 2.0 | 1.0 | 4.0 | Stop-loss distance as a multiple of ATR. |
| AtrTargetMult | 3.0 | 1.0 | 6.0 | Take-profit distance as a multiple of ATR. |
| UseBaselineExit | 1 | 0 | 1 | 1 = also exit when price closes back through the Kijun against the trade; 0 = rely on stop/target only. |
| Lots | 0.10 | 0.01 | 1.0 | Trade volume (position size) in lots. |
Recommended Chart Settings
The Ichimoku Baseline Breakout runs on a single timeframe — whichever chart you attach it to. The classic Ichimoku periods (9 / 26 / 52) were originally designed with the daily (D1) chart in mind, and these remain a sensible starting point for study. That said, the strategy's trend-following logic can be examined on intraday charts such as H1 or H4 on major forex pairs (for example EUR/USD or GBP/USD), where trends tend to be cleaner than on very low timeframes.
Because the system is trend-driven, it is best studied on liquid instruments and timeframes that produce sustained directional moves rather than constant chop. Remember that behavior will vary considerably across different symbols, timeframes, and market conditions — a setting that looks reasonable in one environment may perform very differently in another. Always test on your chosen market before drawing conclusions.
How to Install on MetaTrader 5
- Download the
IchimokuBaselineBreakout.ex5file from the link below. - Copy it to your MT5
MQL5\Expertsfolder. - Restart MetaTrader 5 or refresh the Navigator panel.
- Drag the EA onto a chart matching the recommended symbol and timeframe.
- Configure the input parameters and enable Algo Trading.
What to Consider Before Using This EA
Strengths of this approach. The strategy's biggest advantage is discipline. By requiring price to be on the correct side of the cloud and showing bullish/bearish line alignment and a fresh baseline reclaim, it filters out a large number of low-quality signals and keeps trades aligned with the dominant trend. The ATR-based stop and target mean risk parameters adapt automatically to volatility rather than using fixed pip distances, and the optional baseline-break exit gives the system a logical way to leave a trade when the structure it relied on has broken.
Known limitations of this indicator. Ichimoku is fundamentally a trend tool, and like all trend systems it can struggle in ranging or choppy markets. In sideways conditions, price may repeatedly cross back and forth through the baseline, producing false reclaim signals that get stopped out — a pattern often called "whipsaw." Because the lines are lagging by nature (they are built from lookback windows), entries can arrive after a meaningful part of a move has already happened. The strategy also enters at market with a fixed stop and target, so it does not trail profits on strong runners.
Where it may underperform. Expect the approach to be tested during low-volatility consolidations, news-driven spikes that jump through stops, and abrupt trend reversals where price is above the cloud one moment and collapsing the next. No single set of parameters is optimal in every regime, and over-tuning the settings to past data (curve-fitting) can make results look better in a backtest than they hold up in live conditions. Treat this EA as a structured framework to study, not a guaranteed outcome.
Risk Management Tips
Sound risk management matters far more than any single entry signal. Consider these general principles as part of your education:
- Risk a small, fixed fraction per trade. Many educators suggest risking no more than 1–2% of account equity on any one position. Choose a lot size consistent with your stop distance and account balance rather than trading an arbitrary volume.
- Always test on a demo account first. Run the strategy on a demo or paper account across many market conditions before considering any real capital. This lets you understand its behavior — including losing streaks — without financial consequences.
- Understand drawdown. Every strategy experiences losing periods. Know the largest peak-to-trough decline you are willing to tolerate, and stop to reassess if you approach it.
- Account for costs. Spreads, commissions, and slippage all affect real-world results and are easy to overlook when studying a strategy in theory.
- Never trade money you cannot afford to lose, and keep leverage modest — it magnifies losses just as much as gains.
Position sizing, patience, and consistency are what separate a durable process from a fragile one. Use this strategy as a way to practice those habits in a controlled, low-stakes setting.
Risk Warning
Trading foreign exchange, CFDs, and other leveraged financial instruments involves substantial risk of loss and is not suitable for all investors. The strategies and tools discussed on this page are provided for educational purposes only and do not constitute financial advice, investment recommendations, or solicitation to trade. Always consult a qualified financial adviser before making trading decisions. Past backtest performance is not indicative of future results.
Downloads
- Expert Advisor: IchimokuBaselineBreakout.ex5 (45 downloads)
- Source Code: IchimokuBaselineBreakout.mq5 (45 downloads)
- Documentation: IchimokuBaselineBreakout.pdf (47 downloads)