Disclaimer: This article is for educational and informational purposes only. It does not constitute financial or investment advice. Trading forex and CFDs carries significant risk of loss. Past performance of any strategy — including backtests — does not guarantee future results. Never trade with money you cannot afford to lose.
What Is This Strategy?
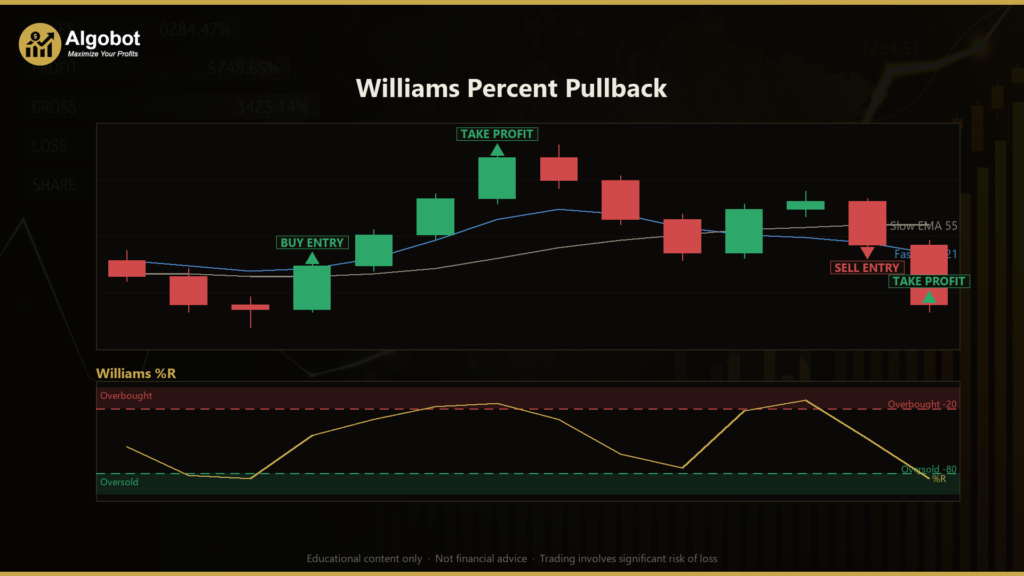
The Williams Percent Pullback strategy is a trend-following pullback system built around the Williams %R momentum oscillator, paired with a dual Exponential Moving Average (EMA) trend filter. Williams %R is a classic indicator that measures where the most recent close sits relative to the high-low range of the last N bars, plotted on a scale from 0 (the top of the range) down to -100 (the bottom). Rather than treating oscillator extremes as reversal signals, this strategy uses them to time entries in the direction of the existing trend — buying temporary dips inside an uptrend and selling temporary rallies inside a downtrend.
The core idea is patience. A moving average pair establishes which way the market is leaning, and then the strategy waits. It does not chase price when a move is already extended. Instead, it watches for momentum to stretch into the counter-trend extreme — a pullback — and then recover back out of it. That moment of recovery, when momentum turns back to align with the prevailing trend, is treated as a favourable entry point. The goal of this design is to enter at a better price than a breakout chaser would, while still trading with the larger trend rather than against it.
This strategy is best suited to traders who are studying trend-following mechanics, oscillator behaviour, and the concept of "buying the dip" in a rules-based, non-discretionary way. It is a single-timeframe, one-position-at-a-time system with clearly defined risk controls, which makes it a useful learning tool for understanding how trend filters and momentum triggers can be combined. It is not a high-frequency system and it is not designed to trade in every market condition.
How It Works
The strategy evaluates its rules once per newly-closed bar, while managing any open trade on every tick. Here is the logic in plain English:
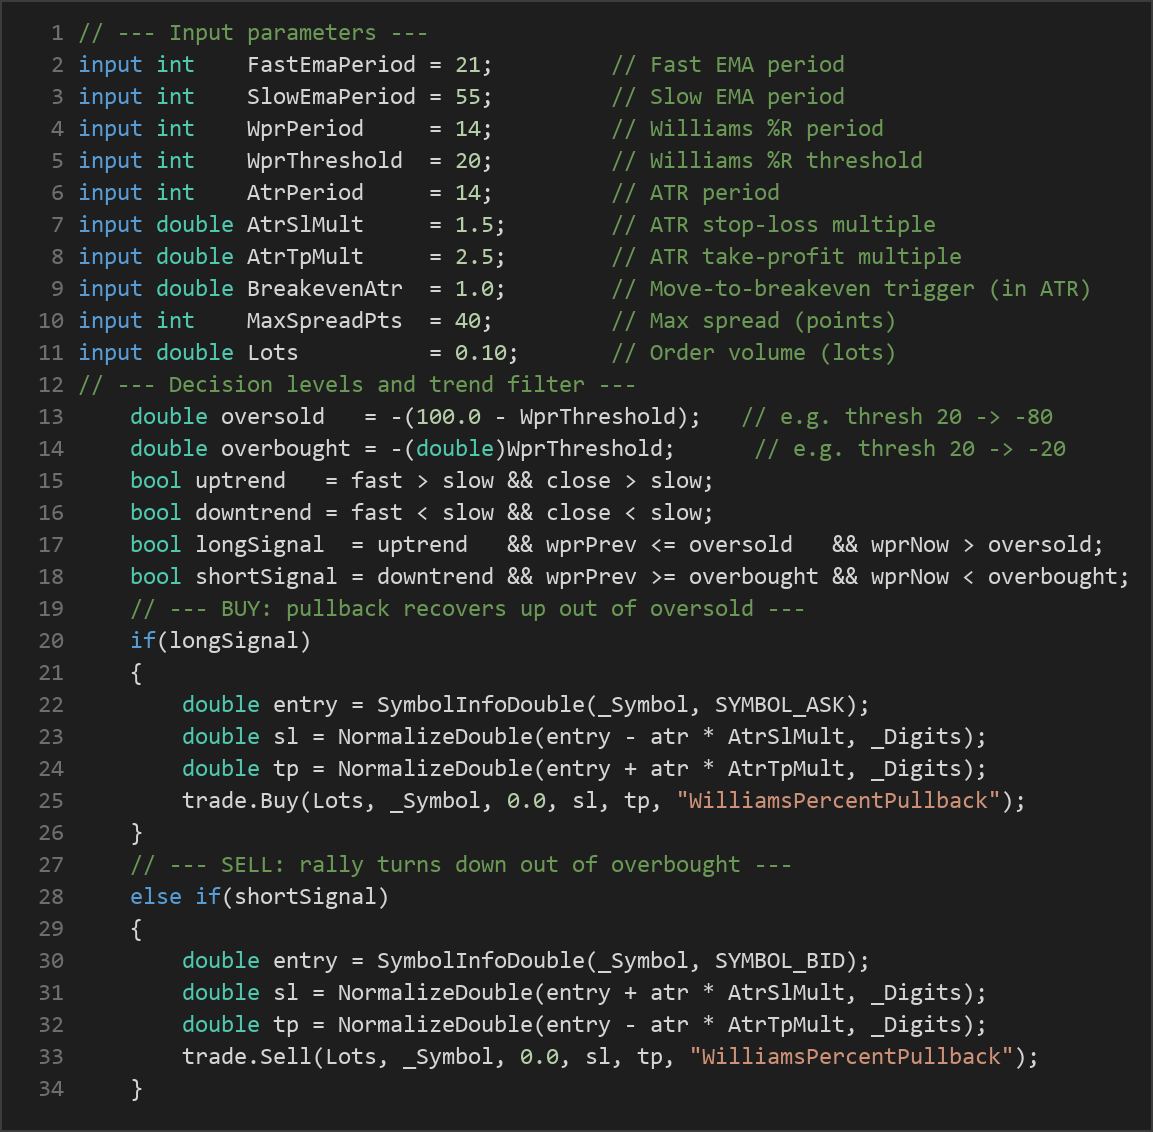
- Trend filter (the context): A fast EMA and a slow EMA define the trend. An uptrend exists when the fast EMA is above the slow EMA and price closes above the slow EMA. A downtrend exists when the fast EMA is below the slow EMA and price closes below the slow EMA.
- Oversold / overbought levels: From the
WprThresholdsetting the strategy derives two Williams %R levels. With the default threshold of 20, the oversold level is -80 and the overbought level is -20. - Long entry signal: In a confirmed uptrend, the strategy signals a buy when Williams %R was at or below the oversold level on the prior bar and then crosses back up through it on the current bar. This is the pullback recovering with the trend.
- Short entry signal: In a confirmed downtrend, the strategy signals a sell when Williams %R was at or above the overbought level on the prior bar and then crosses back down through it on the current bar.
- One position at a time: If a trade is already open for this strategy's magic number, no new entry is taken.
- Spread filter: If the current spread exceeds
MaxSpreadPts, the entry is skipped to avoid trading in abnormally wide, illiquid conditions. - Stop-loss: Risk is defined by volatility. For a long, the stop is placed
AtrSlMult × ATRbelow the entry; for a short, the same distance above it. ATR (Average True Range) measures recent volatility, so the stop automatically widens in fast markets and tightens in calm ones. - Take-profit: The target is placed
AtrTpMult × ATRaway from entry. With the defaults (1.5 stop, 2.5 target) this frames a reward-to-risk ratio of roughly 1.67-to-1 at entry. - Move-to-breakeven: Once price has travelled
BreakevenAtr × ATRin favour of the trade, the stop-loss is moved to the entry price. This is a one-way lock intended to reduce the risk of a winning trade turning into a loss; it does not trail beyond breakeven.
Strategy Parameters
| Parameter | Default | Min | Max | Description |
|---|---|---|---|---|
| FastEmaPeriod | 21 | 5 | 80 | Look-back period of the fast EMA used in the trend filter. |
| SlowEmaPeriod | 55 | 20 | 200 | Look-back period of the slow EMA; defines the underlying trend. |
| WprPeriod | 14 | 5 | 40 | Number of bars used to calculate Williams %R. |
| WprThreshold | 20 | 10 | 35 | Sets the oversold (-(100−threshold)) and overbought (−threshold) levels. |
| AtrPeriod | 14 | 5 | 40 | Look-back period for the ATR volatility measure. |
| AtrSlMult | 1.5 | 0.5 | 4.0 | Stop-loss distance as a multiple of ATR. |
| AtrTpMult | 2.5 | 1.0 | 6.0 | Take-profit distance as a multiple of ATR. |
| BreakevenAtr | 1.0 | 0.2 | 3.0 | ATR distance price must travel in favour before the stop moves to breakeven. |
| MaxSpreadPts | 40 | 5 | 200 | Maximum allowed spread (in points) for a new entry. |
| Lots | 0.10 | 0.01 | 1.0 | Fixed order volume in lots. |
Recommended Chart Settings
This strategy was designed as a single-timeframe system and works most naturally on liquid instruments where trends and pullbacks are reasonably clean. A common starting point for study is a major forex pair such as EUR/USD on the H1 (1-hour) or H4 (4-hour) timeframe, where the default EMA periods (21 and 55) describe a meaningful trend without reacting to every minor fluctuation. Because the risk parameters are ATR-based, the strategy adapts its stop and target to the volatility of whatever symbol you apply it to.
Keep in mind that these are starting points, not fixed recommendations. Results will vary considerably across different symbols, timeframes, brokers, and market conditions. Any change to the symbol, session, or timeframe changes the character of the pullbacks the strategy will encounter, so treat every new configuration as something to study on a demo account before drawing conclusions.
How to Install on MetaTrader 5
- Download the
WilliamsPercentPullback.ex5file from the link below. - Copy it to your MT5
MQL5\Expertsfolder. - Restart MetaTrader 5 or refresh the Navigator panel.
- Drag the EA onto a chart matching the recommended symbol and timeframe.
- Configure the input parameters and enable Algo Trading.
What to Consider Before Using This EA
Strengths. The design has a clear internal logic: it only takes trades aligned with the EMA-defined trend, and it waits for a momentum pullback to recover rather than chasing extended price. This trend-plus-pullback structure historically tends to produce entries at more favourable prices than pure breakout entries. The ATR-based stop and target mean risk scales with volatility instead of using a fixed pip distance, and the move-to-breakeven rule is a sensible attempt to protect trades that have already moved in your favour. Because only one position is open at a time and the rules are fully mechanical, the behaviour is transparent and repeatable.
Limitations. Williams %R, like all oscillators, can remain "pinned" at an extreme during strong momentum, which may delay or skip entries during the most powerful part of a trend. The EMA trend filter is a lagging measure — in choppy, sideways markets the fast and slow EMAs can cross back and forth, producing conflicting or whipsawing signals with no sustained trend to profit from. Fixed-ratio ATR targets mean the strategy does not let winners run beyond the take-profit level, so it may leave extended moves on the table. The breakeven logic locks the stop only once and does not trail further, so a trade can still give back most of an unrealised gain if price reverses just short of the target.
Where it may underperform. Range-bound and low-volatility conditions, news-driven spikes, and instruments with wide or erratic spreads are all environments where this approach may struggle. The spread filter helps, but it cannot compensate for a market that simply lacks the clean trend-and-pullback structure the strategy is built to exploit.
Risk Management Tips
Sound risk management matters far more than any single entry rule. Consider these general principles as part of your education:
- Risk a small fraction per trade. A widely taught guideline is to risk no more than 1–2% of your account balance on any single position. Use the ATR-based stop distance to work out an appropriate lot size rather than trading a fixed volume blindly.
- Test on a demo account first. Run the strategy in a risk-free simulated environment across many different market conditions before ever considering real capital. This is how you learn its behaviour, not just its rules.
- Understand drawdown. Every strategy experiences losing streaks. Study the depth and duration of drawdowns in testing so you know what a normal rough patch looks like and are less likely to abandon a plan at the worst moment.
- Mind costs and conditions. Spreads, commissions, slippage, and swap can meaningfully affect outcomes, especially on shorter timeframes. Account for them in any evaluation.
- Never over-leverage. Leverage magnifies losses as much as gains. Size positions so that a string of stop-outs would not threaten your account.
Risk Warning
Trading foreign exchange, CFDs, and other leveraged financial instruments involves substantial risk of loss and is not suitable for all investors. The strategies and tools discussed on this page are provided for educational purposes only and do not constitute financial advice, investment recommendations, or solicitation to trade. Always consult a qualified financial adviser before making trading decisions. Past backtest performance is not indicative of future results.
Downloads
- Expert Advisor: WilliamsPercentPullback.ex5 (57 downloads)
- Source Code: WilliamsPercentPullback.mq5 (61 downloads)
- Documentation: WilliamsPercentPullback.pdf (55 downloads)