Disclaimer: This article is for educational and informational purposes only. It does not constitute financial or investment advice. Trading forex and CFDs carries significant risk of loss. Past performance of any strategy — including backtests — does not guarantee future results. Never trade with money you cannot afford to lose.
What Is This Strategy?
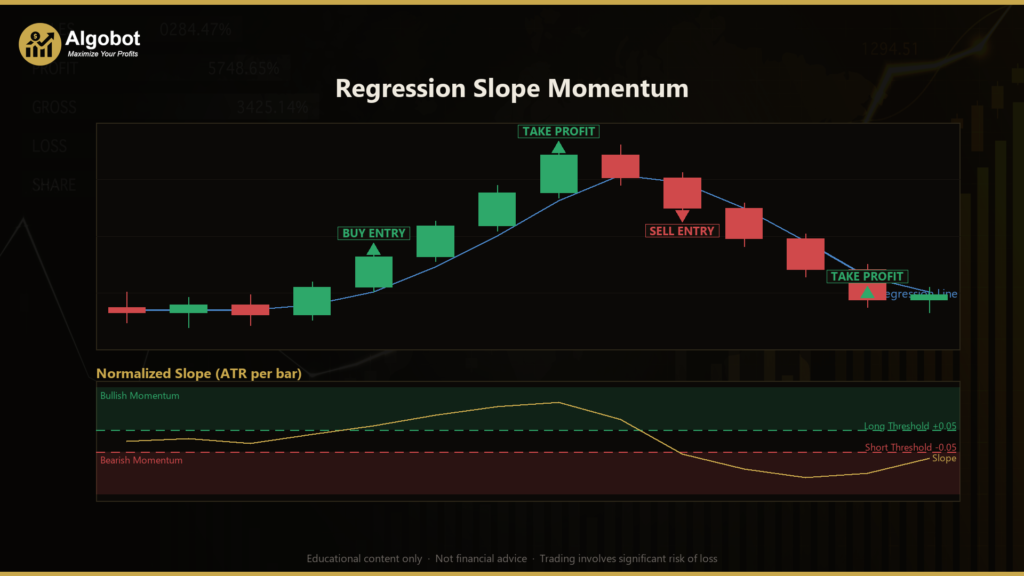
Regression Slope Momentum is a trend-momentum trading strategy that reads market direction from the slope of a linear regression line — a least-squares "line of best fit" drawn through the most recent closing prices. Instead of reacting to a single candle or a simple moving-average crossover, it measures how steeply price has been trending over a fixed window of bars, then converts that steepness into a momentum reading you can compare against a fixed rule.
The key idea is volatility adjustment. The raw regression slope tells you the average price change per bar, but a slope of "5 pips per bar" means something very different on a quiet range day than on a fast-moving news day. To handle this, the strategy divides the slope by the Average True Range (ATR) — a standard measure of recent volatility — producing a normalized reading expressed in "ATR per bar." A signal only fires when this normalized slope freshly crosses a threshold, which filters out weak, choppy conditions and only acts when momentum genuinely accelerates in one direction.
As a learning tool, this approach suits traders who want to study trend-following and momentum concepts in a systematic, rules-based way. It is designed for trending markets and deliberately stays out of low-slope, sideways conditions. Because the logic is transparent and every parameter is exposed, it is a useful example for understanding how regression, volatility normalization, and discrete signal generation fit together. It is not designed for scalping or for ranging markets where price lacks a clear directional slope.
How It Works
The strategy evaluates its rules once per completed bar — it does not react to every tick — which keeps signals stable and repeatable. Here is the logic in plain English:
- Measure the trend slope: A least-squares linear regression line is fitted to the last
RegPeriodclosing prices. The slope of that line represents the average price change per bar. A positive slope means an uptrend; a negative slope means a downtrend. - Normalize by volatility: The slope is divided by the current ATR value, producing a "normalized slope" in units of ATR per bar. This makes the reading comparable across calm and volatile periods.
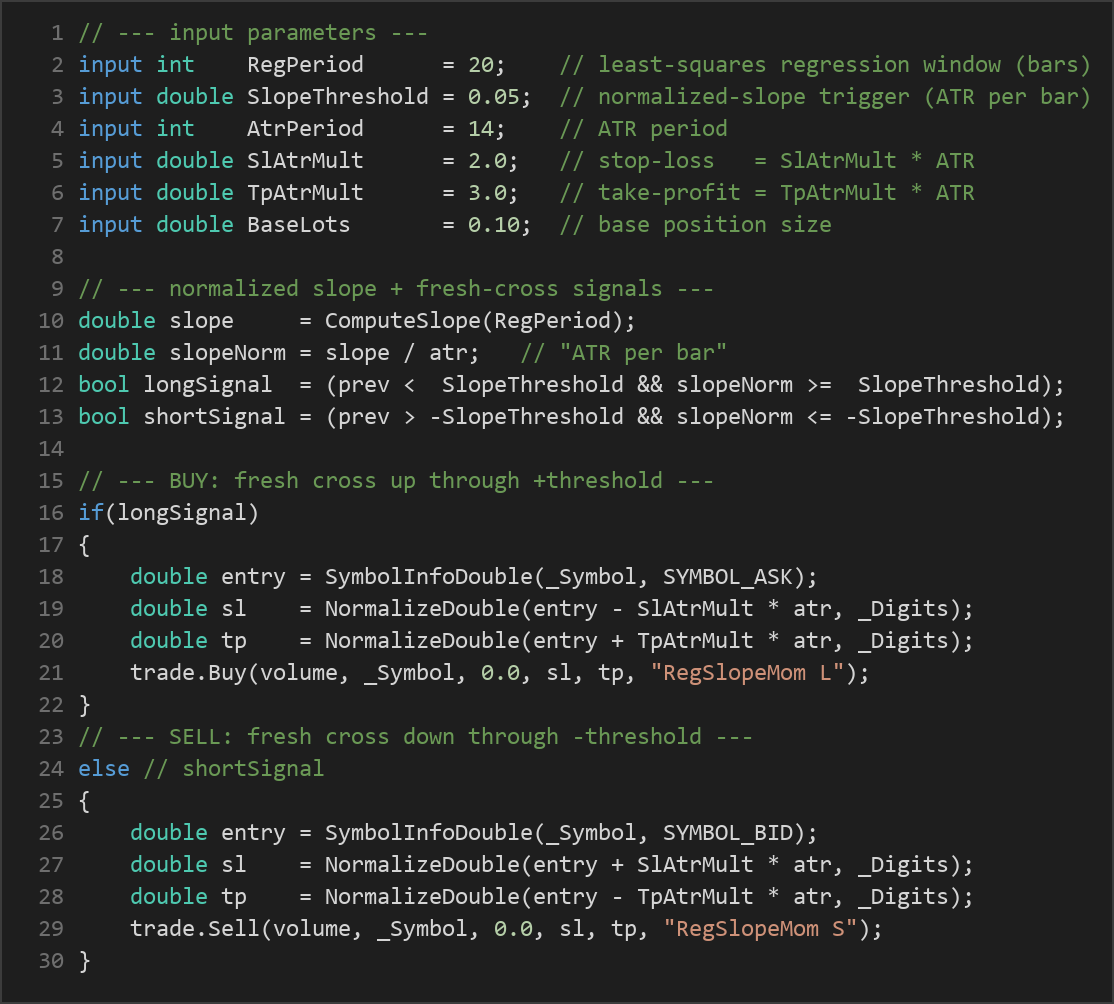
- Wait for a fresh cross (long): The strategy signals a buy when the normalized slope was below the
SlopeThresholdon the previous bar and rises to or above it on the current bar — a fresh upside momentum breakout. - Wait for a fresh cross (short): The strategy signals a sell when the normalized slope was above the negative threshold and falls to or below
-SlopeThreshold— a fresh downside momentum breakout. - Exit-and-reverse: If a position is already open and the opposite signal appears, the strategy closes the existing trade. Otherwise, while a trade is open, it simply holds and lets the stop-loss and take-profit manage the position.
- One position at a time: The strategy does not stack multiple trades on the same symbol; it holds a single position and only opens a new one once the previous one is closed.
Stop-loss logic: When a trade opens, the stop-loss is placed at SlAtrMult × ATR away from the entry price — below entry for longs, above entry for shorts. Because it is tied to ATR, the stop automatically widens in volatile conditions and tightens in calm ones.
Take-profit logic: The take-profit is placed at TpAtrMult × ATR from entry in the direction of the trade. With the default settings (stop at 2× ATR, target at 3× ATR), the strategy aims for a reward-to-risk profile of roughly 1.5:1.
Position sizing: Trade size is volatility-targeted and equity-scaled. A volatility factor shrinks the position when current ATR rises above the baseline captured at startup, helping keep per-trade risk steadier when markets get fast. An equity factor lets size grow as the account balance compounds. The final volume is clamped to a sensible band around the base size and rounded to the broker's allowed lot step.
Strategy Parameters
| Parameter | Default | Min | Max | Description |
|---|---|---|---|---|
| RegPeriod | 20 | 8 | 60 | Number of closing prices in the regression window. Larger values smooth the slope and react more slowly; smaller values are more responsive but noisier. |
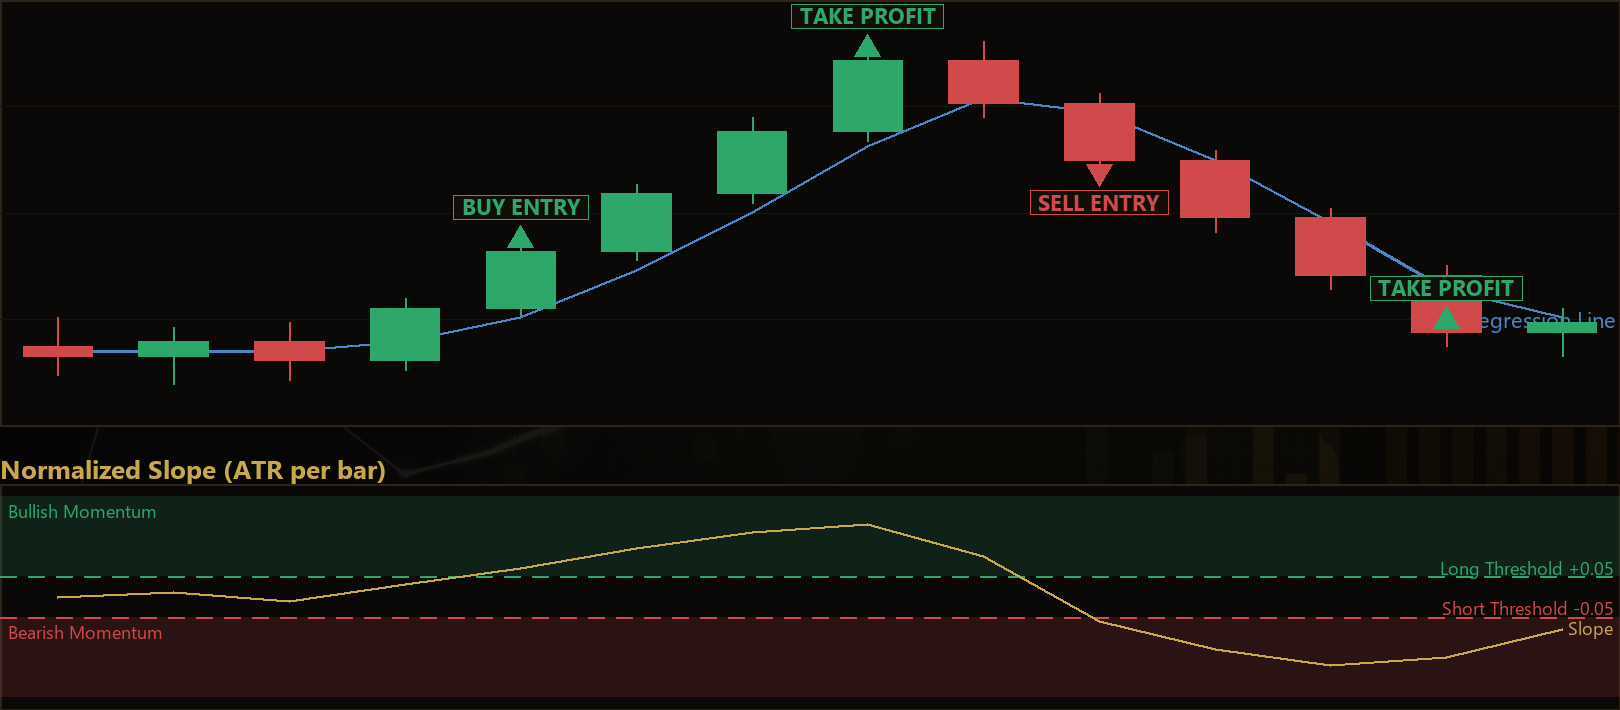
| SlopeThreshold | 0.05 | 0.01 | 0.30 | The normalized-slope trigger level (in ATR per bar). Higher values demand stronger momentum before a signal fires, producing fewer but more selective trades. |
| AtrPeriod | 14 | 7 | 30 | Lookback period for the Average True Range used to normalize the slope and to size stops, targets, and position volume. |
| SlAtrMult | 2.0 | 1.0 | 4.0 | Stop-loss distance as a multiple of ATR. Larger values give trades more room but risk more per trade. |
| TpAtrMult | 3.0 | 1.0 | 6.0 | Take-profit distance as a multiple of ATR. Sets the profit target and, together with the stop multiple, the reward-to-risk ratio. |
| BaseLots | 0.10 | 0.01 | 1.0 | Base position size before volatility and equity scaling are applied. |
Recommended Chart Settings
Regression Slope Momentum is a trend-momentum strategy and generally works best on instruments and timeframes that produce sustained directional moves rather than tight ranges. A common starting point for study is a major forex pair such as EUR/USD on the H1 (1-hour) timeframe, which offers enough bars for the regression window while filtering out much of the noise found on very short timeframes.
That said, the default parameters are a neutral baseline, not an optimized configuration. The regression window, slope threshold, and ATR multipliers all interact with the character of the market you apply them to. Results will vary considerably across different symbols, timeframes, and market conditions, so treat any single setup as a subject for testing rather than a finished recipe.
How to Install on MetaTrader 5
- Download the .ex5 file from the link below
- Copy it to your MT5
MQL5\Expertsfolder - Restart MetaTrader 5 or refresh the Navigator panel
- Drag the EA onto a chart matching the recommended symbol and timeframe
- Configure the input parameters and enable Algo Trading
What to Consider Before Using This EA
Every strategy involves trade-offs, and an honest view of both sides helps you learn faster.
Strengths of this approach:
- The volatility normalization means the same threshold behaves consistently across calm and turbulent periods, which is a thoughtful piece of design compared with a fixed price-slope rule.
- Acting only on a fresh cross of the threshold gates out low-momentum chop and avoids re-triggering on every tick, encouraging fewer and cleaner entries.
- ATR-based stops and targets adapt automatically to current conditions instead of using fixed pip distances.
- The exit-and-reverse logic keeps the strategy aligned with the prevailing direction rather than fighting a clear trend.
Known limitations:
- Like all trend and momentum systems, it can struggle in ranging or whipsawing markets, where the slope repeatedly crosses the threshold and generates false signals that get stopped out.
- The regression slope is inherently lagging — it describes momentum that has already developed, so entries can arrive after a portion of the move is complete.
- The volatility baseline and balance baseline are locked at startup, which means sizing behavior depends on the conditions present when the EA first initializes.
- A reward-to-risk target above 1:1 does not, by itself, ensure profitability; the win rate and the frequency of whipsaws matter just as much.
The sensible path is to study how the strategy behaves in different regimes — trending, ranging, high-volatility, low-volatility — rather than assuming any one setting works everywhere.
Risk Management Tips
Sound risk management matters more than any single entry rule. Keep these general principles in mind as you study this or any strategy:
- Risk a small fraction per trade. Many educators suggest risking no more than 1–2% of account equity on any single position, so that a string of losses does not seriously damage your account.
- Test on a demo account first. Run the strategy in a risk-free simulated environment until you understand its behavior, its typical drawdowns, and how the parameters interact.
- Understand drawdown. Even a well-designed trend system can suffer extended losing streaks during ranging markets. Know the maximum drawdown you are willing to tolerate before you commit real capital.
- Size positions deliberately. The built-in volatility and equity scaling helps, but you should still verify that the resulting lot sizes match your personal risk tolerance and account size.
- Avoid over-optimization. Tuning parameters until they fit past data perfectly ("curve-fitting") often produces settings that fail on new data. Favor robust settings that work reasonably across many conditions.
- Trade only what you can afford to lose. Leverage magnifies both gains and losses, so never risk money you need for other purposes.
Risk Warning
Trading foreign exchange, CFDs, and other leveraged financial instruments involves substantial risk of loss and is not suitable for all investors. The strategies and tools discussed on this page are provided for educational purposes only and do not constitute financial advice, investment recommendations, or solicitation to trade. Always consult a qualified financial adviser before making trading decisions. Past backtest performance is not indicative of future results.
Downloads
- Expert Advisor: RegressionSlopeMomentum.ex5 (53 downloads)
- Source Code: RegressionSlopeMomentum.mq5 (60 downloads)
- Documentation: RegressionSlopeMomentum.pdf (63 downloads)