Disclaimer: This article is for educational and informational purposes only. It does not constitute financial or investment advice. Trading forex and CFDs carries significant risk of loss. Past performance of any strategy — including backtests — does not guarantee future results. Never trade with money you cannot afford to lose.
What Is This Strategy?
The Rsi Midline Trend Continuation strategy is a trend-following system that combines the Relative Strength Index (RSI) — a momentum oscillator that measures the speed and size of recent price moves on a 0–100 scale — with a pair of Exponential Moving Averages (EMAs) that define the prevailing trend. Rather than trying to catch tops and bottoms, this is a pullback continuation approach: it only looks to trade in the direction an established trend is already pointing.
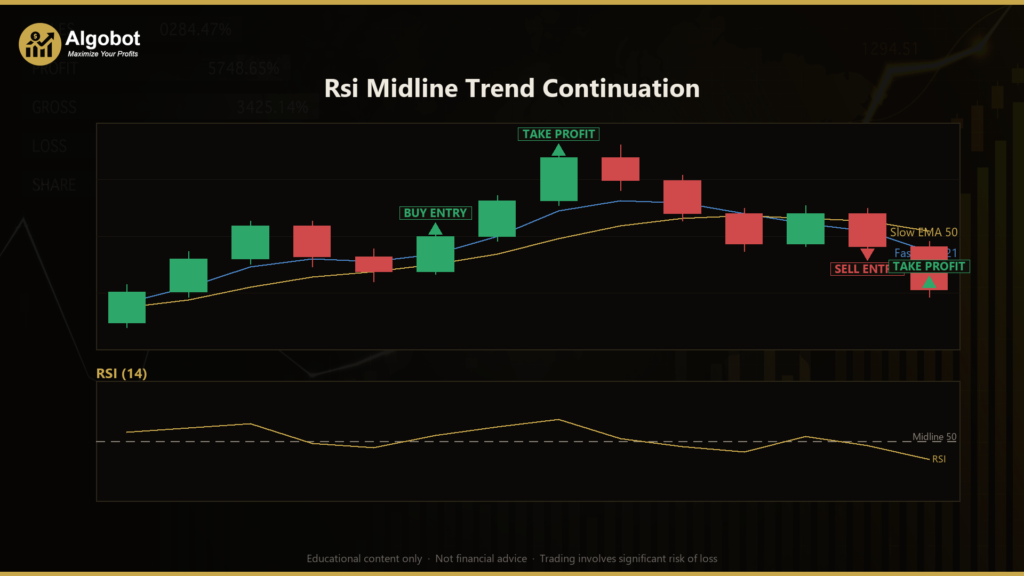
The core idea is simple to state. Strong trends rarely reverse on every small wobble; more often they pause, catch their breath, and then resume. This strategy waits for exactly that pause. It requires the faster EMA to be above (or below) the slower EMA, with the slower EMA sloping in the same direction, to confirm that a trend genuinely exists. It then waits for a shallow momentum dip and enters when the RSI reclaims its 50 mid-line from the pullback side — a sign that momentum is resuming with the trend rather than a guess that an overbought or oversold market is about to flip.
As a learning tool, this strategy is well suited to traders who want to understand how momentum filters and trend filters can be combined to reduce false signals. It demonstrates several concepts worth studying: multi-condition confirmation, Average True Range (ATR) based stops that adapt to volatility, fixed reward-to-risk targets, percentage-based position sizing, and an automatic break-even move. Frame your study of it as an analysis of how the logic behaves — not as a shortcut to results.
How It Works
The strategy evaluates its rules only on closed bars of the chart's primary timeframe, so signals do not flicker mid-candle. Here is the logic in plain English:
- Defining an uptrend: The strategy considers the market to be in an uptrend when the Fast EMA is above the Slow EMA and the Slow EMA is sloping upward (compared with its value a set number of bars ago).
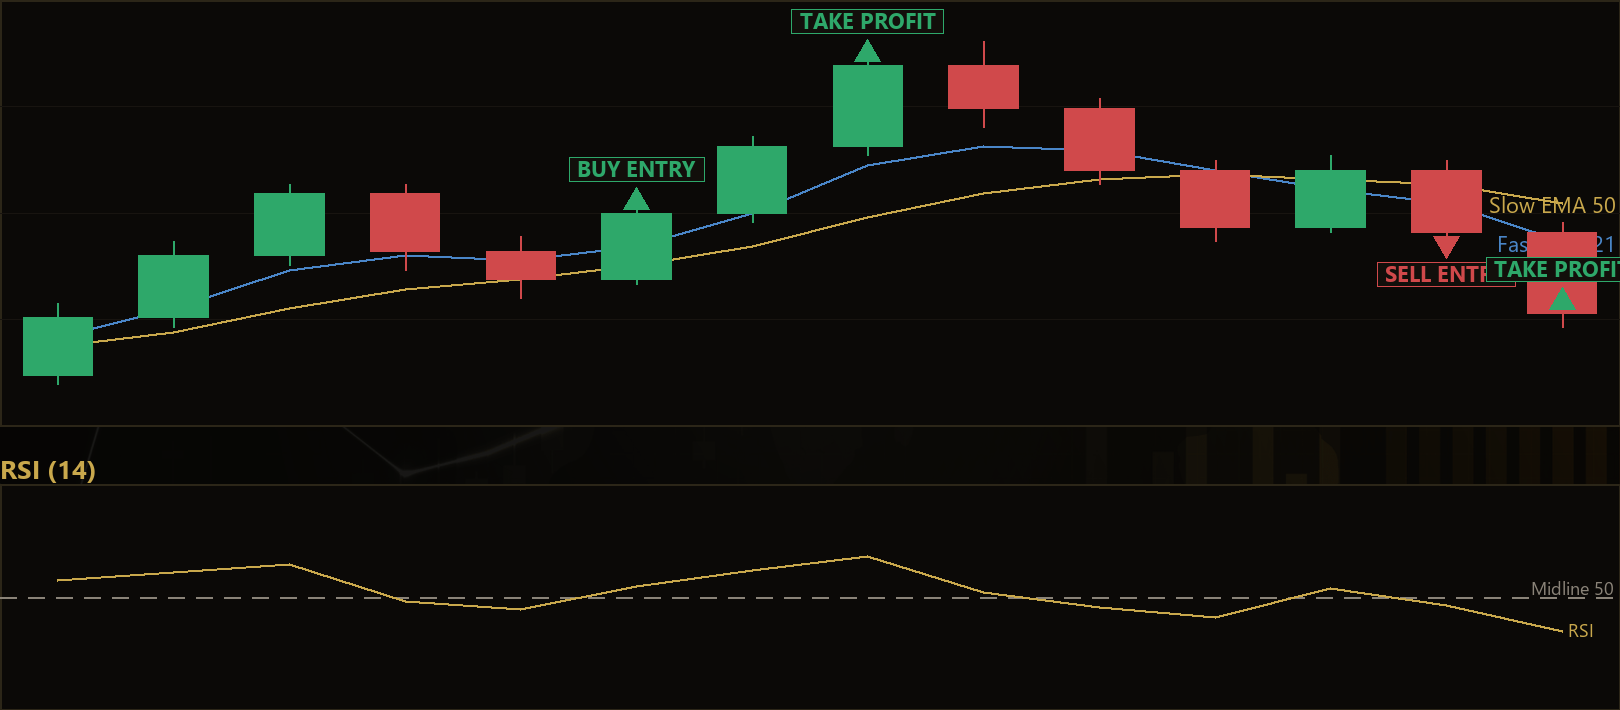
- Long (buy) entry: During a confirmed uptrend, the strategy signals a long entry when the RSI was below 50 on the previous bar and closes at or above 50 on the current bar. This is the momentum "reclaim" after a shallow pullback.
- Defining a downtrend: The market is considered to be in a downtrend when the Fast EMA is below the Slow EMA and the Slow EMA is sloping downward.
- Short (sell) entry: During a confirmed downtrend, the strategy signals a short entry when the RSI was above 50 on the previous bar and closes at or below 50 on the current bar.
- One trade at a time: The system holds only a single position. While a trade is open, it manages that position and takes no new entries.
For exits and risk control, the strategy uses a structured, rules-based framework:
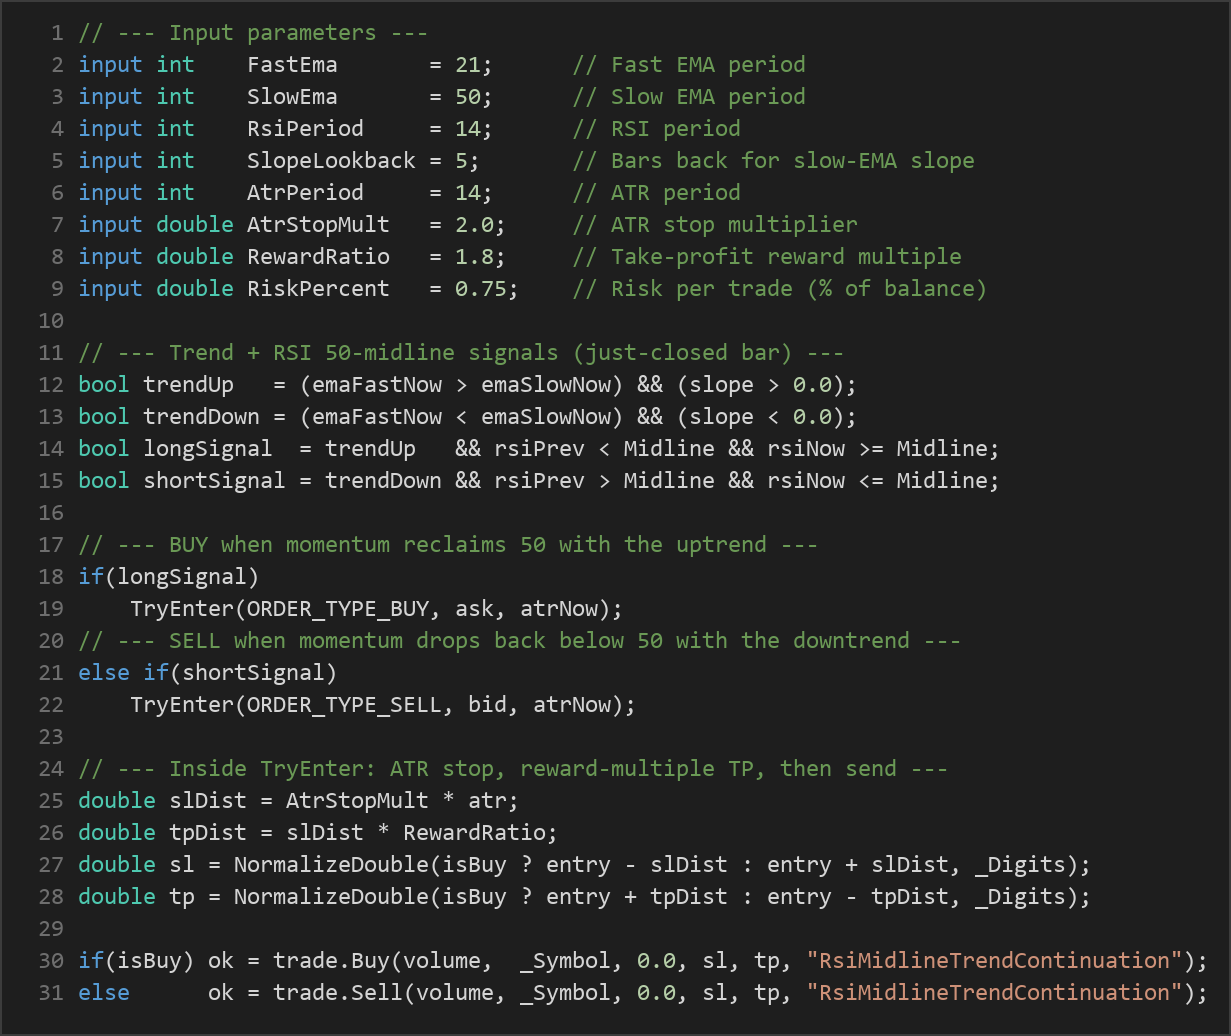
- Stop-loss (ATR-based): When a trade is opened, the stop distance is set to the ATR multiplied by the ATR stop multiplier. Because ATR measures recent volatility, the stop automatically widens in fast markets and tightens in quiet ones. The stop is never placed closer than the broker's minimum stop level plus the current spread, which helps avoid rejected orders.
- Take-profit (reward multiple): The take-profit is placed at the stop distance multiplied by the reward ratio. For example, with the default 1.8 reward ratio, the target sits 1.8 times as far from entry as the stop — a fixed reward-to-risk structure.
- Break-even move: Once price has advanced by one "R" (one full stop distance, i.e. +1R) in the trade's favour, the strategy moves the stop-loss to the entry price. This is designed to remove the initial risk from a trade that has started working, helping to cap drawdown.
- Position sizing: Volume is calculated so that a full stop-out risks approximately the configured percentage of account balance, then rounded down to the broker's volume step and clamped within the symbol's minimum and maximum lot sizes.
Strategy Parameters
| Parameter | Default | Min | Max | Description |
|---|---|---|---|---|
| FastEma | 21 | 8 | 50 | Period of the fast Exponential Moving Average used to gauge the shorter-term trend. |
| SlowEma | 50 | 30 | 120 | Period of the slow EMA that defines the dominant trend and provides the slope filter. |
| RsiPeriod | 14 | 7 | 28 | Lookback period for the RSI momentum oscillator that generates the mid-line trigger. |
| SlopeLookback | 5 | 2 | 15 | Number of bars back used to measure whether the slow EMA is sloping up or down. |
| AtrPeriod | 14 | 7 | 30 | Lookback period for the ATR volatility measure used to size the stop-loss. |
| AtrStopMult | 2.0 | 1.0 | 4.0 | Multiplier applied to ATR to set the stop-loss distance from entry. |
| RewardRatio | 1.8 | 1.0 | 3.5 | Take-profit distance as a multiple of the stop distance (reward-to-risk ratio). |
| RiskPercent | 0.75 | 0.1 | 2.0 | Percentage of account balance risked on a single trade, used for position sizing. |
Note that FastEma is automatically adjusted to be strictly shorter than SlowEma if you configure it otherwise, keeping the two-EMA relationship valid.
Recommended Chart Settings
Because every decision is taken on closed bars of the chart's primary timeframe, this strategy runs on whatever timeframe you attach it to — the logic adapts to the chart. A common starting point for trend-continuation systems of this kind is a liquid major currency pair such as EUR/USD on an intraday-to-swing timeframe (for example, the H1 or H4 chart), where trends tend to develop with enough follow-through for a continuation entry to make sense.
That said, treat these as a starting point for study, not a fixed prescription. The behaviour of any moving-average and RSI combination changes with the instrument's volatility and character, and results will vary across different market conditions, symbols, and sessions. Always test on the specific symbol and timeframe you intend to study before drawing any conclusions.
How to Install on MetaTrader 5
- Download the .ex5 file from the link below
- Copy it to your MT5
MQL5\Expertsfolder - Restart MetaTrader 5 or refresh the Navigator panel
- Drag the EA onto a chart matching the recommended symbol and timeframe
- Configure the input parameters and enable Algo Trading
What to Consider Before Using This EA
The strengths of the Rsi Midline Trend Continuation approach come from its layered confirmation. By requiring both an EMA alignment and an EMA slope and an RSI mid-line reclaim, it filters out many of the random signals that a single indicator would produce. Trading only with the trend, combined with a volatility-adaptive ATR stop and a fixed reward target, gives the logic a clear and repeatable structure — which is precisely what makes it useful as a study of disciplined, rules-based trading.
There are, however, real limitations to understand. Trend-continuation systems are designed for trending conditions, and they historically tend to struggle in choppy, range-bound markets where the EMAs cross back and forth and the RSI oscillates around 50 without follow-through. In such conditions, the strategy may generate signals that are quickly stopped out — a phenomenon often called "whipsaw." The slope and mid-line filters reduce this but cannot eliminate it.
You should also recognise that a fixed reward ratio means the strategy will let some winning trades reverse before reaching target, and the break-even rule, while protective, can turn otherwise profitable trades into scratch (zero) results if price pulls back after +1R. No parameter set works equally well across all instruments or eras, so avoid over-fitting to a single historical period. Study the trade-offs; do not assume the defaults are optimal.
Risk Management Tips
Sound risk management matters more than any single indicator setting. As you study this strategy, keep these general principles in mind:
- Risk a small, fixed percentage per trade. Many educational sources suggest never risking more than 1–2% of account balance on a single position. The default
RiskPercentof 0.75 sits comfortably within this range. - Use a demo account first. Test the strategy in a risk-free simulated environment until you understand how it behaves in different market conditions before considering any live use.
- Understand drawdown. Every strategy experiences losing streaks. Know the maximum peak-to-trough decline you are willing to tolerate, and size your positions so a normal losing sequence does not threaten your account.
- Do not over-leverage. Leverage magnifies both gains and losses. Keep total exposure modest relative to account size.
- Review, don't set-and-forget. Markets evolve; periodically review whether the strategy's assumptions still hold for the instrument and timeframe you are studying.
Risk Warning
Trading foreign exchange, CFDs, and other leveraged financial instruments involves substantial risk of loss and is not suitable for all investors. The strategies and tools discussed on this page are provided for educational purposes only and do not constitute financial advice, investment recommendations, or solicitation to trade. Always consult a qualified financial adviser before making trading decisions. Past backtest performance is not indicative of future results.
Downloads
- Expert Advisor: RsiMidlineTrendContinuation.ex5 (55 downloads)
- Source Code: RsiMidlineTrendContinuation.mq5 (61 downloads)
- Documentation: RsiMidlineTrendContinuation.pdf (72 downloads)