Disclaimer: This article is for educational and informational purposes only. It does not constitute financial or investment advice. Trading forex and CFDs carries significant risk of loss. Past performance of any strategy — including backtests — does not guarantee future results. Never trade with money you cannot afford to lose.
What Is This Strategy?
The Fisher Transform Reversal is a trend-filtered mean-reversion strategy built around Ehlers' Fisher Transform, a momentum oscillator that reshapes price data so that turning points become sharper and easier to read. Mean reversion is a trading style that assumes stretched, over-extended prices tend to snap back toward a fairer value, and the Fisher Transform is unusually well-suited to spotting exactly those stretched moments. Where a raw oscillator often produces a lazy, rounded roll-over that smears a reversal across several bars, the Fisher Transform mathematically stretches extreme readings toward large positive or negative values, so an exhausted move tends to show up as a clean, early kink rather than a vague hump.
What makes this particular approach different from a naive oscillator fade is its trend filter. Fading extremes on their own is dangerous, because strong trends can stay over-extended far longer than a counter-trend trader can survive. To manage that, the Fisher Transform Reversal never fades against the dominant trend — it fades with it. A slow Exponential Moving Average (EMA), a moving average that weights recent prices more heavily, defines the market regime. The strategy only looks for oversold snap-backs while that EMA is rising, and only looks for overbought roll-overs while it is falling. This converts a raw counter-trend signal into a trend-pullback entry.
As a learning tool, this strategy is well-suited to traders who want to study how oscillator signals can be combined with a trend filter to control risk. It illustrates several concepts worth understanding: signal normalization, regime filtering, volatility-adaptive stops, and equity-proportional position sizing. It is best viewed as a framework for analysis and experimentation on a demo account, not as a shortcut to trading results.
How It Works
The Fisher Transform Reversal operates entirely on a single timeframe and acts once per newly closed bar. Here is how the calculation and the trade logic fit together:
- Median price calculation: For each closed bar, the strategy computes the median price as
(High + Low) / 2. This is the raw input the Fisher Transform normalizes. - Normalization: The median price is rescaled to a value between −1 and +1 based on the highest and lowest median price over the
FisherPeriodlookback window. This positions the current price relative to its recent range. - Smoothing and transform: The normalized value is smoothed (
value = 0.33 × x + 0.67 × previous value) and clamped to ±0.999 to keep the math stable. It is then passed through the Fisher Transform formula,0.5 × ln((1 + value) / (1 − value)), blended with its own previous reading. The previous Fisher value acts as the trigger line. - Trend regime filter: A slow EMA of the closing price defines the regime. The strategy measures the EMA's slope over
TrendSlopeLookbackbars. A rising slope signals an uptrend; a falling slope signals a downtrend.
The strategy then signals entries as follows:
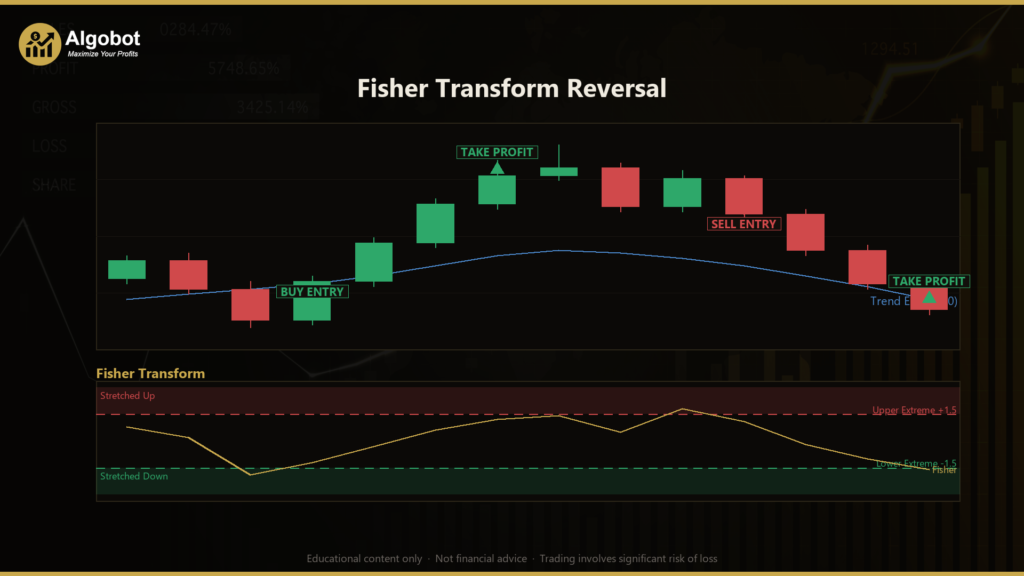
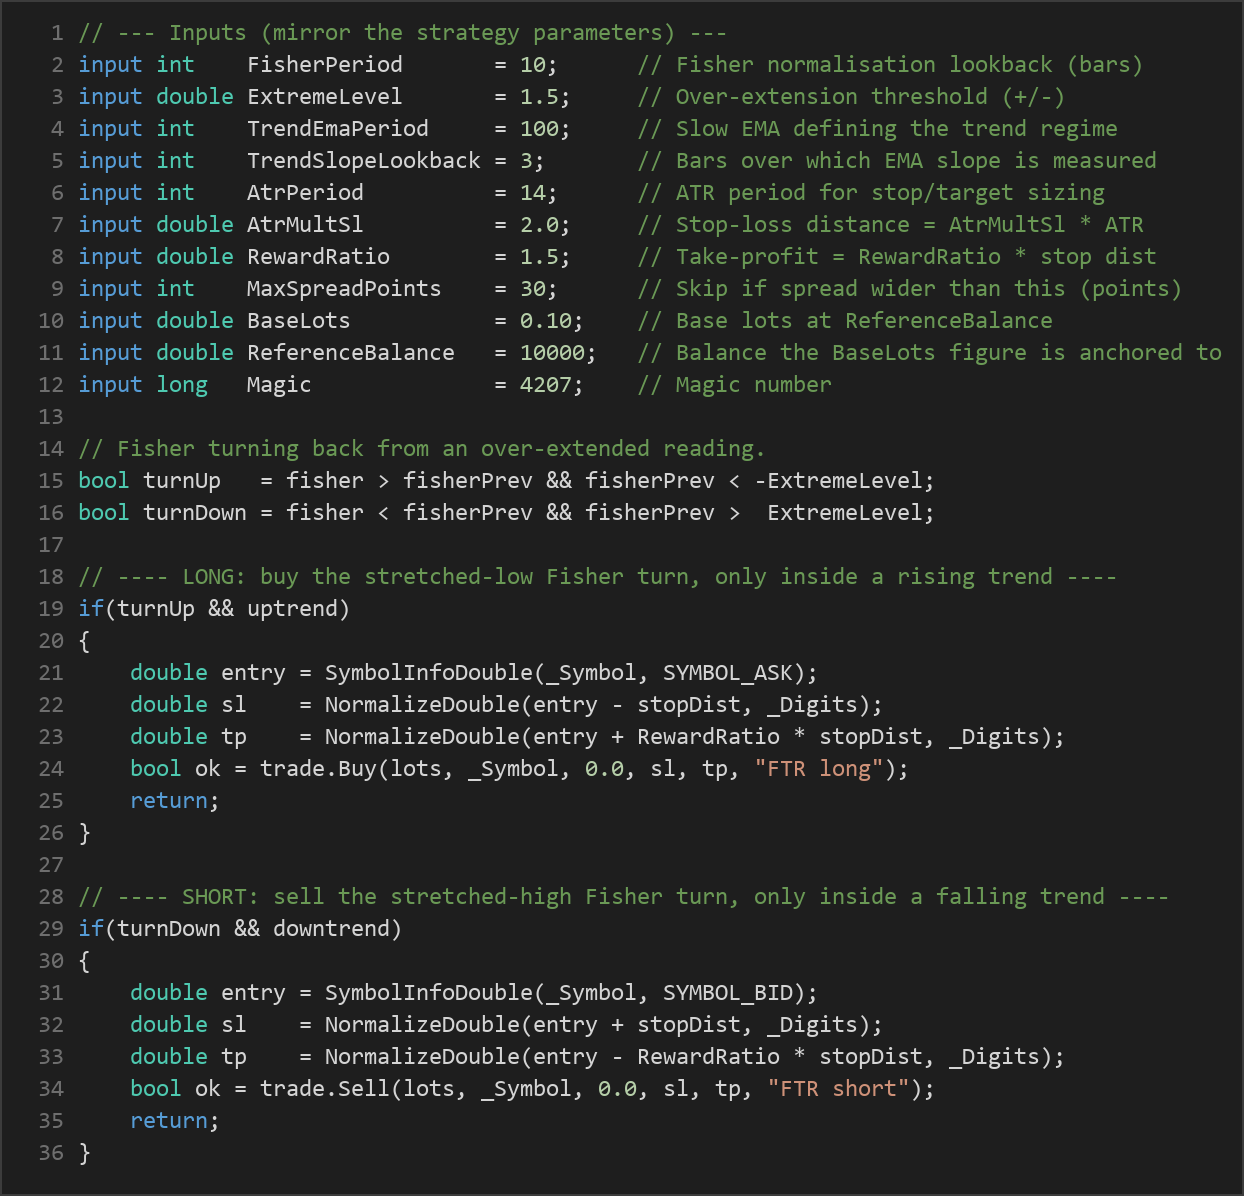
- Long entry: The strategy signals a buy when the Fisher line turns up (the current reading is higher than the previous one) after the previous reading had dipped below
−ExtremeLevel(a genuine oversold stretch), and the trend EMA is rising. This is interpreted as buying the dip of an uptrend at the moment momentum snaps back. - Short entry: The mirror image. The strategy signals a sell when the Fisher line turns down after the previous reading pushed above
+ExtremeLevel, and the trend EMA is falling — selling the bounce of a downtrend.
Exit logic is handled automatically through fixed stops and targets set at entry:
- Stop-loss: Placed at
AtrMultSl × ATRbeyond the entry price. ATR (Average True Range) measures recent volatility, so the stop distance adapts to how much the market is currently moving rather than using a fixed pip value. - Take-profit: Placed at
RewardRatio × stop distancefrom entry. If the stop is 40 pips away and the reward ratio is 1.5, the target sits 60 pips away, defining a fixed reward-to-risk relationship. - Trade management: Only one position per magic number is allowed at a time, and a spread gate skips entries when the current spread is wider than
MaxSpreadPointsto keep transaction costs contained.
Strategy Parameters
| Parameter | Default | Min | Max | Description |
|---|---|---|---|---|
| FisherPeriod | 10 | 5 | 30 | Lookback window (in bars) used to normalize the median price before the Fisher Transform. |
| ExtremeLevel | 1.5 | 0.5 | 3.5 | How far past ±this level the Fisher line must stretch to count as over-extended (oversold/overbought). |
| TrendEmaPeriod | 100 | 20 | 300 | Period of the slow EMA that defines the trend regime the strategy is allowed to trade with. |
| TrendSlopeLookback | 3 | 1 | 20 | Number of bars over which the EMA's slope (rising/falling) is measured. |
| AtrPeriod | 14 | 7 | 30 | ATR period used to size the volatility-adaptive stop and target distances. |
| AtrMultSl | 2.0 | 0.5 | 5.0 | Stop-loss distance expressed as a multiple of ATR. |
| RewardRatio | 1.5 | 0.8 | 4.0 | Take-profit distance as a multiple of the stop distance (reward-to-risk ratio). |
| MaxSpreadPoints | 30 | 1 | 200 | Skip new entries if the current spread (in points) is wider than this value. |
| BaseLots | 0.10 | 0.01 | 1.00 | Base lot size at the reference balance, scaled by live balance. |
| ReferenceBalance | 10000 | 500 | 1000000 | Account balance the BaseLots figure is calibrated to (position-sizing anchor). |
| Magic | 4207 | 0 | 9999999 | Unique identifier so the EA manages only its own trades. |
Recommended Chart Settings
This strategy was designed for liquid markets on intermediate timeframes. A natural home is a liquid major currency pair such as EURUSD or USDJPY, or a major stock index, on the M15 to H1 timeframes. These conditions tend to offer tight spreads and enough clean price swings for the Fisher Transform to identify meaningful extremes.
Because the strategy is volatility-adaptive and symbol/timeframe agnostic in its risk sizing, it can be experimented with on other instruments — but its behavior will vary considerably across different market conditions. A parameter set that historically suited one pair and timeframe may behave very differently on another. Always test any configuration on a demo account before considering live use.
How to Install on MetaTrader 5
- Download the .ex5 file from the link below
- Copy it to your MT5
MQL5\Expertsfolder - Restart MetaTrader 5 or refresh the Navigator panel
- Drag the EA onto a chart matching the recommended symbol and timeframe
- Configure the input parameters and enable Algo Trading
What to Consider Before Using This EA
Every strategy involves trade-offs, and understanding them is part of trading responsibly.
Strengths of this approach:
- The Fisher Transform sharpens turning points, which can produce earlier, less ambiguous reversal signals than many conventional oscillators.
- The trend filter is a genuine risk-control mechanism. By refusing to fade against the dominant regime, the strategy screens out many of the open-ended runs where lone reversal signals tend to bleed out.
- Stops and targets scale with volatility via ATR, so the risk framework adapts automatically to quiet and busy markets alike.
- Position sizing scales gently with account balance, keeping risk proportional rather than fixed.
Known limitations:
- Mean-reversion logic can struggle in strongly trending, low-pullback conditions where extremes keep extending. Even with a trend filter, a sharp trend-aligned reversal signal can fail.
- In choppy, directionless markets, the slow EMA slope may flip frequently, producing conflicting or whipsaw signals.
- The strategy trades one position at a time and waits for bar closes, so it may miss fast intrabar moves.
- Like all oscillator-based systems, it depends on parameter choices that historically suited certain conditions and may not generalize to others.
The goal is to understand how and when the strategy signals, not to assume it will perform a certain way.
Risk Management Tips
Sound risk management matters more than any single indicator. Consider these general principles:
- Risk a small, fixed fraction per trade. Many educational sources suggest risking no more than 1–2% of account equity on any single position, so that a string of losses does not threaten the account.
- Use position sizing deliberately. Adjust
BaseLotsandReferenceBalanceso the resulting lot size matches your intended risk per trade, rather than accepting defaults blindly. - Test on a demo account first. Run the strategy in simulation across varied market conditions before risking real capital, and observe how it behaves during both trending and ranging periods.
- Understand drawdown. Every strategy experiences losing streaks. Know the maximum drawdown you are willing to tolerate and how it would feel to sit through it.
- Avoid over-optimization. A configuration tuned to fit past data perfectly often performs worse going forward. Prefer robust, sensible settings over curve-fitted ones.
Risk Warning
Trading foreign exchange, CFDs, and other leveraged financial instruments involves substantial risk of loss and is not suitable for all investors. The strategies and tools discussed on this page are provided for educational purposes only and do not constitute financial advice, investment recommendations, or solicitation to trade. Always consult a qualified financial adviser before making trading decisions. Past backtest performance is not indicative of future results.
Downloads
- Expert Advisor: FisherTransformReversal.ex5 (60 downloads)
- Source Code: FisherTransformReversal.mq5 (64 downloads)
- Documentation: FisherTransformReversal.pdf (64 downloads)