Disclaimer: This article is for educational and informational purposes only. It does not constitute financial or investment advice. Trading forex and CFDs carries significant risk of loss. Past performance of any strategy — including backtests — does not guarantee future results. Never trade with money you cannot afford to lose.
What Is This Strategy?
Triangular Parity Arbitrage is a statistical mean-reversion Expert Advisor (EA) that trades foreign-exchange cross pairs — currency pairs that do not include the US dollar, such as EURGBP, EURJPY, GBPJPY, AUDNZD, or EURCHF. Its core tool is a rolling z-score (a statistical measure of how far a value sits from its recent average, expressed in standard deviations) applied to the price gap between a cross rate and the "fair" price implied by that cross's two US-dollar legs. In plain terms, it is a relative-value strategy that watches a triangle of related exchange rates and reacts when one corner drifts out of line.
The idea comes from classic triangular arbitrage. A cross such as EURGBP is not an independent price — it is mechanically linked to EURUSD and GBPUSD through the dollar: EURGBP should equal (EUR value in USD) divided by (GBP value in USD). Because all three prices are quoted by separate order books, small latency and liquidity gaps can push the actual cross slightly away from this synthetic parity value. Those dislocations tend to be transient, because the triangle must eventually re-close. This EA is designed to study and trade that tendency for the mispricing to mean-revert — to snap back toward parity.
As a learning tool, this strategy suits traders who want to understand statistical arbitrage, z-score standardisation, and multi-symbol relationships in FX. It is a strategy analysis intended to illustrate how dislocations between correlated instruments can be measured and faded — not a shortcut to results. It is best explored on liquid crosses on lower timeframes (M1 to M15), where the underlying USD legs are deep and the parity relationship is tightest.
How It Works
The EA acts once per newly-closed bar on the chart's timeframe. On each new bar it reads three synchronised closing prices — the cross itself and its two USD legs — then builds a fair "synthetic" cross price and measures how far the real price has drifted from it.
- Building the synthetic price: For a cross BASE/QUOTE, the EA finds each currency's value in USD from its standard dollar pair. Pairs like EURUSD are used directly; pairs where the dollar is the base (for example USDJPY) are inverted to express "value of one unit in USD." Dividing the base value by the quote value gives the synthetic parity price.
- Measuring the deviation: The strategy computes a relative gap,
deviation = (ActualCross − Synthetic) / Synthetic. This is the raw mispricing as a fraction of price. - Standardising into a z-score: Over a rolling
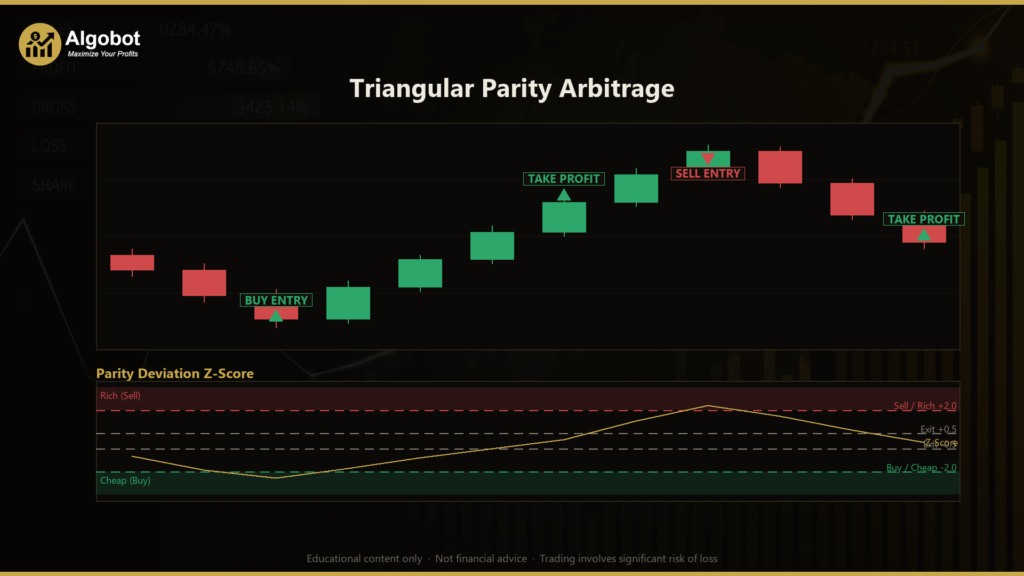
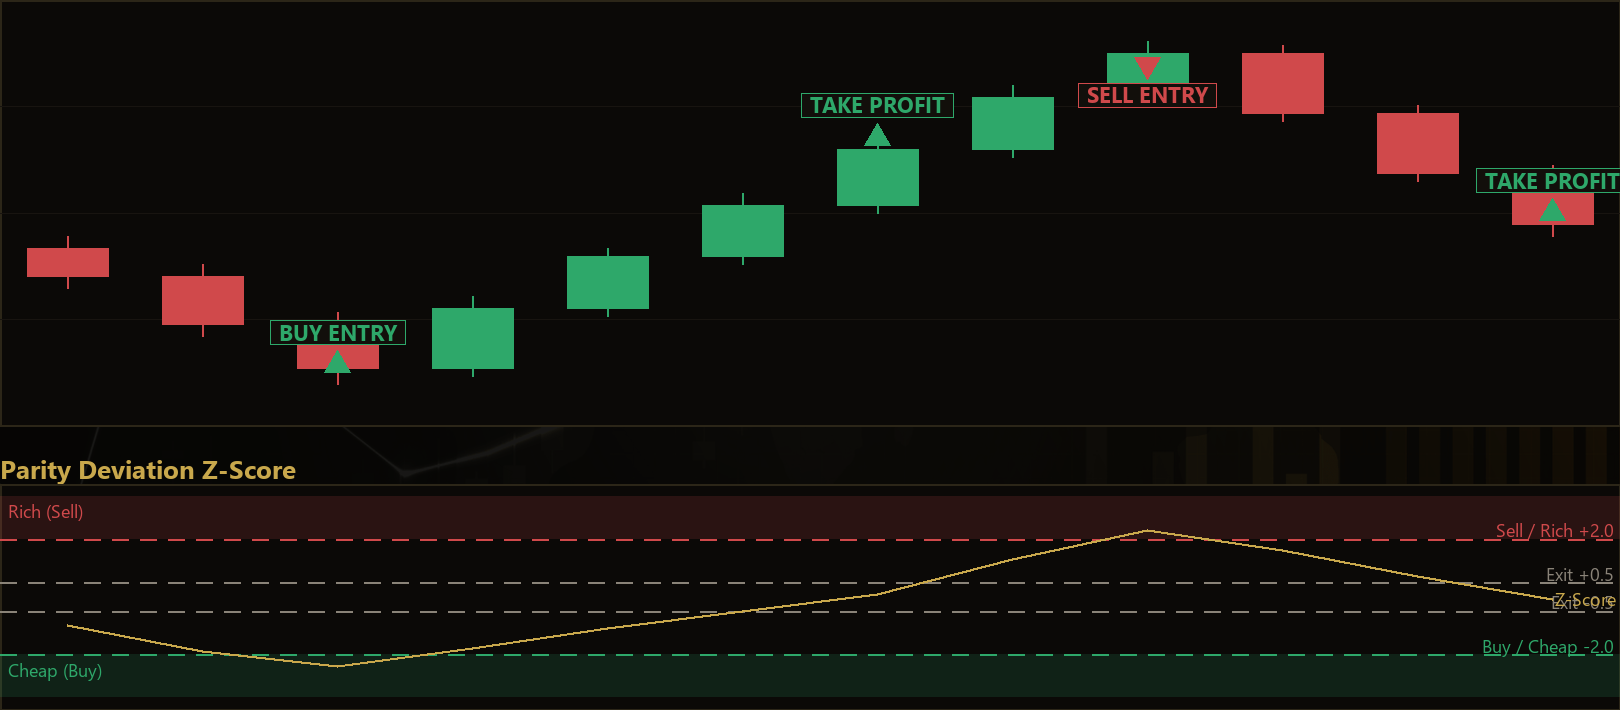
Lookbackwindow, it calculates the mean and standard deviation of that deviation, then converts the current reading into a z-score. A high z-score means the cross is unusually rich versus parity; a low (negative) z-score means it is unusually cheap. - Short entry (sell the cross): The strategy signals a short when the z-score rises to or above
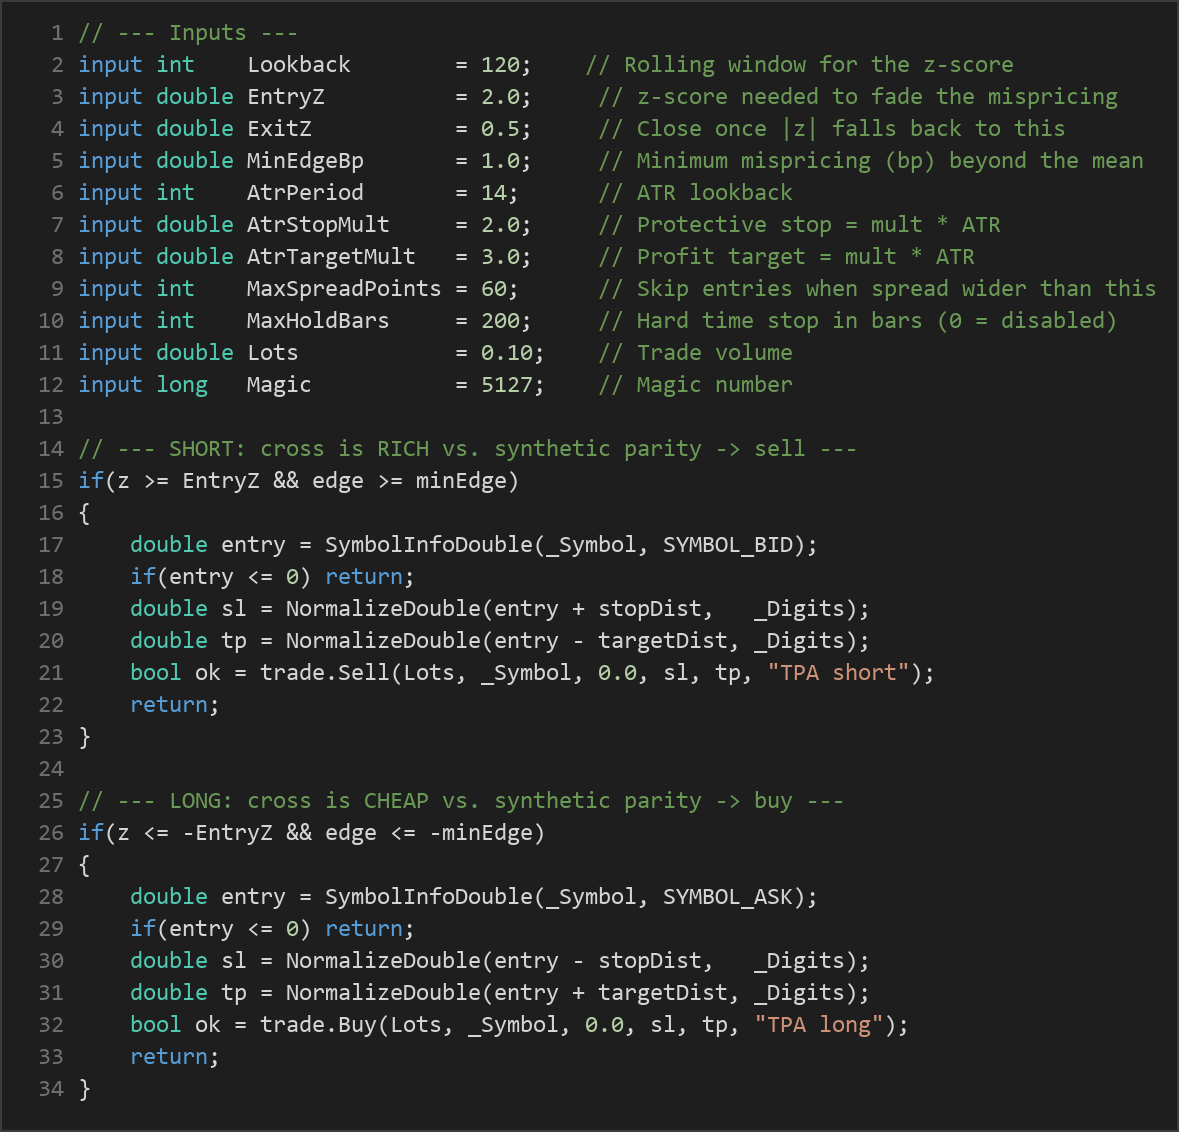
EntryZand the signed edge (deviation minus its rolling mean) is at leastMinEdgeBpbasis points. The logic is that a rich cross may revert downward toward parity. - Long entry (buy the cross): The strategy signals a long when the z-score falls to or below
−EntryZand the edge is at leastMinEdgeBpbasis points to the downside. A cheap cross may revert upward. - Spread filter: New entries are skipped when the cross's spread is wider than
MaxSpreadPoints, so the strategy avoids trading into costly fills. - Exit on convergence: An open position is closed once the absolute z-score falls back to
ExitZor lower — the signal that parity has been restored. - Stop-loss and take-profit: On entry, protective levels are placed using the Average True Range (ATR), an indicator that measures recent volatility. The stop is set
AtrStopMult × ATRaway from entry and the targetAtrTargetMult × ATRaway, so both scale with current market volatility. - Time stop: If a dislocation refuses to converge, the
MaxHoldBarslimit closes the trade after a fixed number of bars so the strategy does not "marry" a stuck position. Only one position is held per triangle at a time.
Importantly, if either USD leg is unavailable to the platform, or the chart symbol is a USD major rather than a genuine cross, the EA stands aside and does not trade.
Strategy Parameters
| Parameter | Default | Min | Max | Description |
|---|---|---|---|---|
| Lookback | 120 | 30 | 400 | Rolling window, in bars, used to compute the mean and standard deviation of the parity deviation for the z-score. |
| EntryZ | 2.0 | 1.0 | 4.0 | The z-score threshold required to open a fade of the mispricing. Higher values demand a larger dislocation. |
| ExitZ | 0.5 | 0.0 | 2.0 | Closes the position once the absolute z-score falls back to this level (parity considered restored). |
| MinEdgeBp | 1.0 | 0.0 | 15.0 | Minimum raw mispricing, in basis points beyond the rolling mean, required before an entry is considered. |
| AtrPeriod | 14 | 5 | 40 | Number of bars used to calculate the ATR that sizes the stop and target. |
| AtrStopMult | 2.0 | 0.5 | 5.0 | Protective stop distance as a multiple of ATR. |
| AtrTargetMult | 3.0 | 0.5 | 8.0 | Profit target distance as a multiple of ATR. |
| MaxSpreadPoints | 60 | 5 | 300 | Maximum cross spread (in points) allowed for a new entry; wider spreads block entries. |
| MaxHoldBars | 200 | 0 | 2000 | Hard time stop in bars (0 disables it) so trades are not held indefinitely. |
| Lots | 0.10 | 0.01 | 1.0 | Trade volume in lots. |
| Magic | 5127 | 0 | 9,999,999 | Magic number used to identify and manage this EA's own positions. |
Recommended Chart Settings
Triangular Parity Arbitrage is designed for liquid non-USD FX crosses — for example EURGBP, EURJPY, GBPJPY, AUDNZD, EURCHF, or AUDJPY — on lower timeframes from M1 to M15, where the two USD legs trade deeply and the parity relationship is tightest. The EA uses whatever timeframe is selected on the chart at run time. It requires the two underlying USD pairs to be available in the platform; if they are not, it safely stands aside. Because market microstructure, spreads, and liquidity differ between brokers and change over time, results will vary across different market conditions, symbols, and account types. Always test on the specific symbol and timeframe you intend to study.
How to Install on MetaTrader 5
- Download the .ex5 file from the link below
- Copy it to your MT5
MQL5\Expertsfolder - Restart MetaTrader 5 or refresh the Navigator panel
- Drag the EA onto a chart matching the recommended symbol and timeframe
- Configure the input parameters and enable Algo Trading
What to Consider Before Using This EA
This approach has some genuine conceptual strengths. It is grounded in a real, well-understood market relationship — the arithmetic link between a cross and its two dollar legs — rather than a purely curve-fitted pattern. Its signals are volatility-aware through ATR-based stops and targets, it filters out noise with the basis-point edge and z-score thresholds, and it avoids expensive fills with a spread filter. The convergence exit and time stop give each trade a defined lifecycle.
There are equally important limitations to understand. Statistical arbitrage assumes dislocations revert, but a gap can widen before it closes — or reflect a genuine structural shift rather than transient noise, in which case the position may hit its stop. The parity calculation depends on clean, synchronised data from three symbols; missing or lagging leg data, or a broker symbol suffix the parser does not expect, can cause the EA to stand aside or misjudge the gap. Very tight "true" arbitrage edges are usually captured by faster participants, so on a bar engine the tradable edge is the residual, noisier drift — which is why the strategy fades statistical deviations rather than instant riskless gaps. Performance may weaken in fast-trending regimes, around high-impact news, during illiquid sessions, or when spreads widen and swallow the modest edge. Treat it as an educational study of relative-value mechanics, not a finished system.
Risk Management Tips
Sound risk management matters more than any single parameter. Consider these general principles as you study this EA:
- Use a demo account first. Test the strategy in a risk-free simulated environment until you understand its behaviour across different conditions before considering any live capital.
- Size positions conservatively. A common educational guideline is to risk no more than 1–2% of account equity on any single trade. The
Lotsinput is fixed, so relate it to your account size and the ATR-based stop distance. - Understand drawdown. Every strategy experiences losing streaks. Know the maximum drawdown you are willing to tolerate and how it would feel in practice before committing funds.
- Account for costs. Spreads, commissions, and swap can erode a small statistical edge — factor them into any analysis.
- Avoid over-optimisation. Tuning parameters to fit past data ("curve fitting") often produces results that do not hold up going forward. Prefer robust settings that work across a range of conditions.
- Never risk money you cannot afford to lose, and consult a qualified financial adviser about your own circumstances.
Risk Warning
Trading foreign exchange, CFDs, and other leveraged financial instruments involves substantial risk of loss and is not suitable for all investors. The strategies and tools discussed on this page are provided for educational purposes only and do not constitute financial advice, investment recommendations, or solicitation to trade. Always consult a qualified financial adviser before making trading decisions. Past backtest performance is not indicative of future results.
Downloads
- Expert Advisor: TriangularParityArbitrage.ex5 (0 downloads)
- Source Code: TriangularParityArbitrage.mq5 (1 downloads)
- Documentation: TriangularParityArbitrage.pdf (0 downloads)