Disclaimer: This article is for educational and informational purposes only. It does not constitute financial or investment advice. Trading forex and CFDs carries significant risk of loss. Past performance of any strategy — including backtests — does not guarantee future results. Never trade with money you cannot afford to lose.
What Is This Strategy?
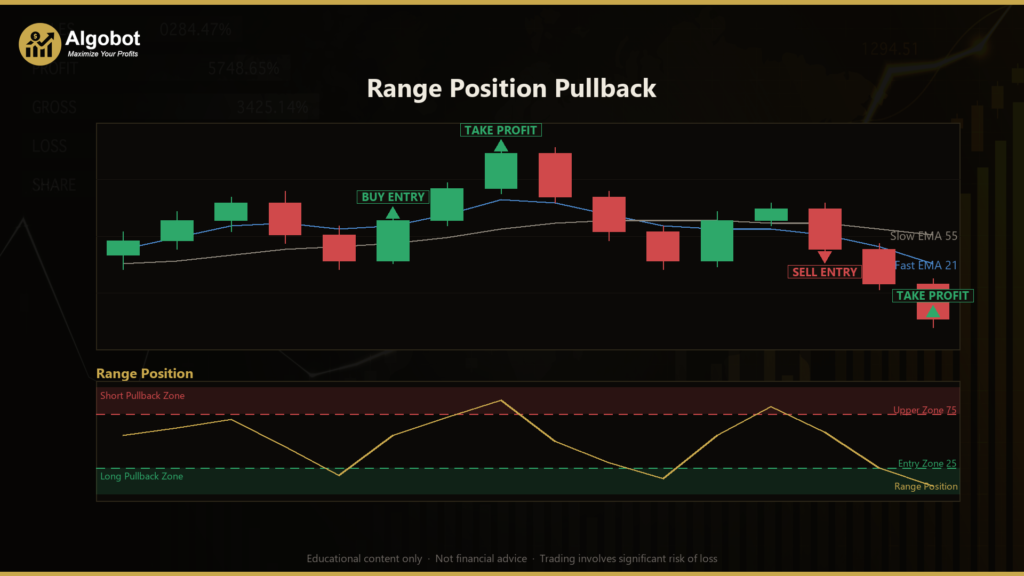
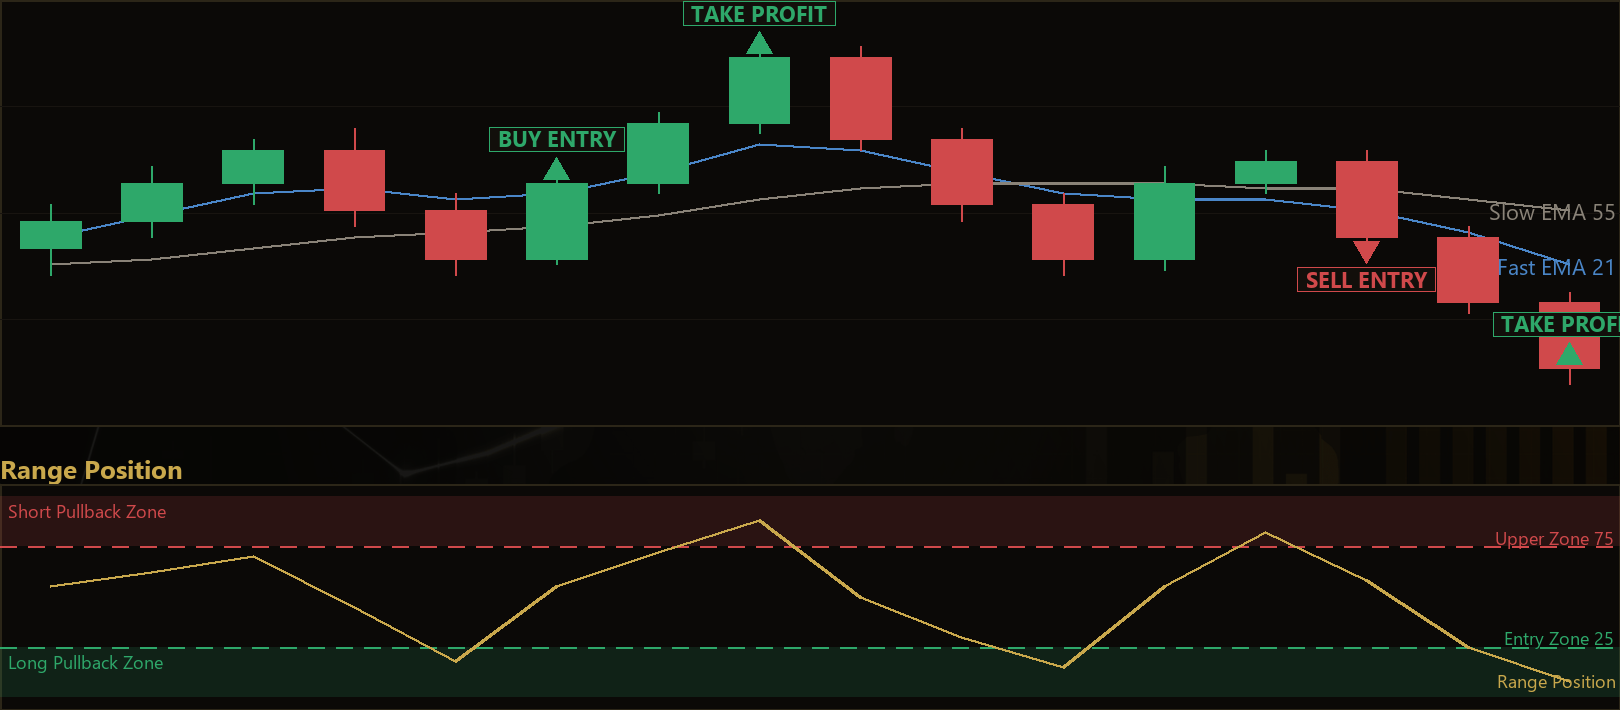
The Range Position Pullback strategy is a trend-following pullback system that times its entries with a self-computed "range position" oscillator — a normalized measure of where the latest closing price sits inside its recent high-to-low channel. Instead of chasing breakouts or fading extremes, it combines a dual-EMA trend filter (an Exponential Moving Average, or EMA, is a moving average that gives more weight to recent prices) with a momentum-style oscillator to identify moments when a healthy counter-trend dip appears to have exhausted and price begins to resume in the direction of the prevailing trend.
The core idea rests on a well-known market behavior: established trends rarely move in a straight line — they "breathe," advancing and then retracing before advancing again. This strategy is designed for trending market conditions, where a defined direction exists and temporary pullbacks offer potential continuation entries. It deliberately avoids ranging or choppy environments, since its trend gates are built to keep it flat when no clear direction is present.
As a learning tool, the Range Position Pullback is well suited to traders who want to study how trend filters, oscillators, and structured risk management can be combined into a single rules-based framework. It illustrates several important concepts at once: trend confirmation, pullback timing, volatility-based stops using the Average True Range (ATR — a measure of typical price movement over a period), and active trade management. This article frames the strategy as an analytical case study, not as a profit opportunity.
How It Works
The strategy acts once per newly closed bar and evaluates each signal using completed price data rather than the still-forming candle. It computes the range position as:
pos = (Close − LowestLow) / (HighestHigh − LowestLow) × 100
A reading near 0 means the close is pinned to the bottom of the recent range (a deep pullback within an uptrend), while a reading near 100 means the close is pinned to the top (a deep pullback within a downtrend).
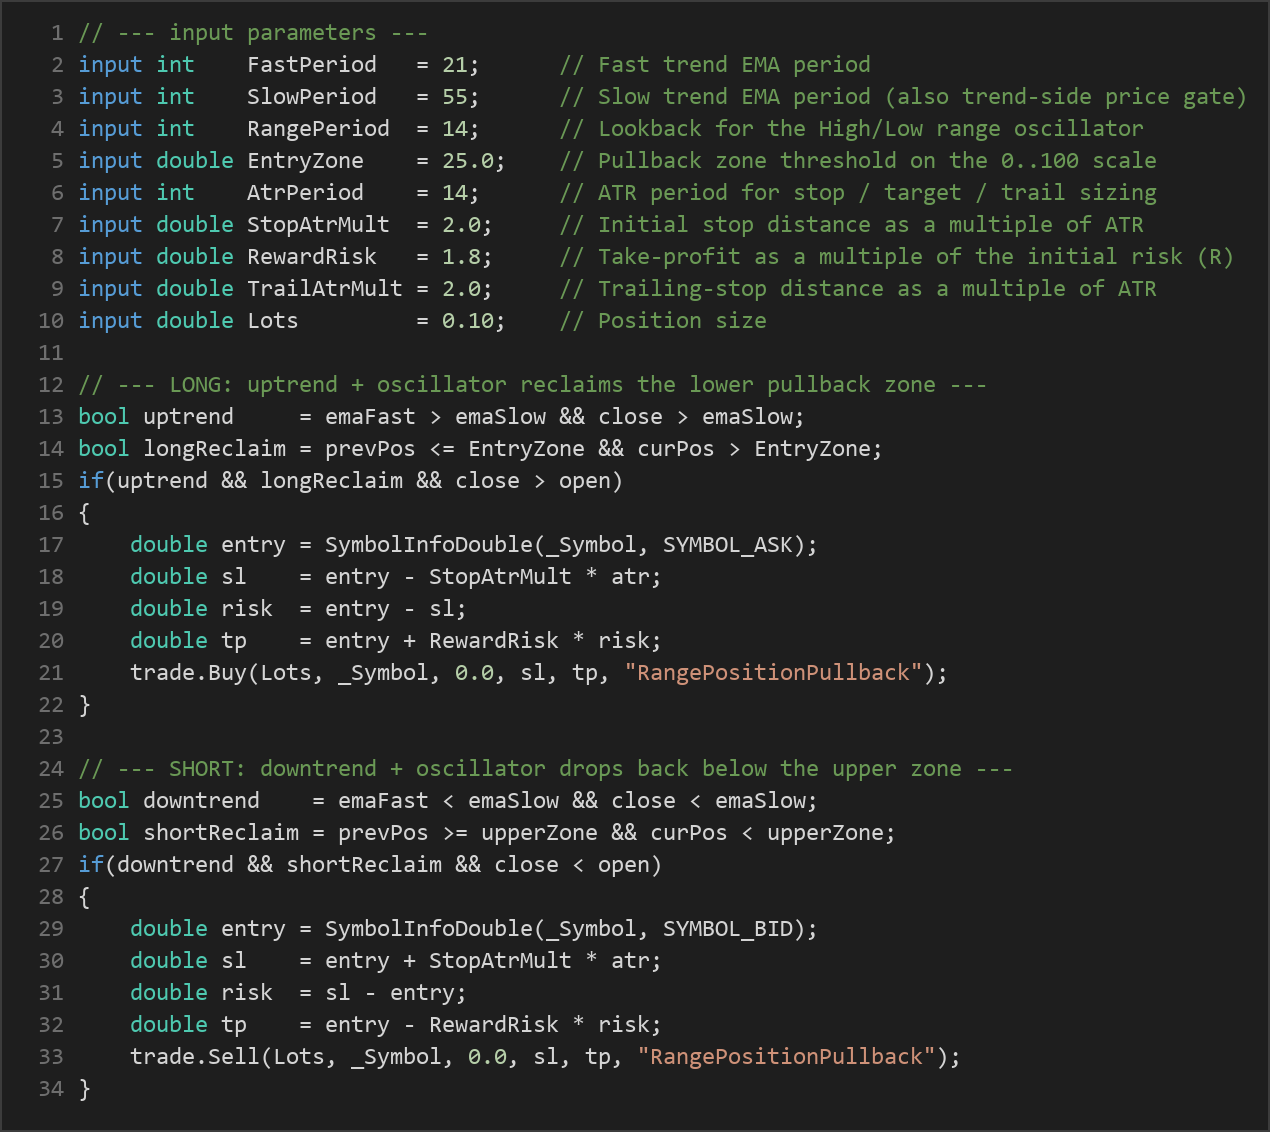
The strategy signals a long (buy) entry when all of the following align:
- Trend is up: the fast EMA is above the slow EMA, and the closing price is above the slow EMA. This dual condition confirms both momentum and price location favor the upside.
- A pullback occurred and reclaimed: on the prior bar the oscillator had dipped into the lower pullback zone (at or below
EntryZone), and on the current bar it has climbed back above that zone. This "dip then reclaim" transition is the heart of the logic — it waits for the pullback to exhaust rather than entering on the extreme itself. - Confirmation candle: the just-closed bar is bullish (close above open), suggesting buyers have stepped back in.
The strategy signals a short (sell) entry under the mirror-image conditions:
- Trend is down: the fast EMA is below the slow EMA, and the close is below the slow EMA.
- A rally occurred and faded: the oscillator had risen into the upper zone (at or above
100 − EntryZone) on the prior bar and has dropped back below it on the current bar. - Confirmation candle: the just-closed bar is bearish (close below open).
Stop-loss logic: When a trade opens, the initial stop is placed at a distance of StopAtrMult × ATR from the entry price. Anchoring the stop to ATR means the risk distance adapts to current volatility rather than using a fixed pip value.
Take-profit logic: The target is set at RewardRisk multiples of the initial risk (R). For example, with the default 1.8 reward-to-risk, if the stop sits 50 pips away, the target is placed 90 pips from entry.
Trade management (two stages):
- Break-even move: once price advances by +1R (one unit of initial risk) in favor of the trade, the stop is moved up to the entry price to reduce exposure.
- ATR trailing stop: thereafter the stop trails price by
TrailAtrMult × ATR, tightening only in the trade's favor and never loosening. This is designed to help protect open profit if the trend continues.
Only one position per symbol is held at a time, and exits are governed entirely by the stop, target, and trailing logic.
Strategy Parameters
| Parameter | Default | Min | Max | Description |
|---|---|---|---|---|
| FastPeriod | 21 | 5 | 60 | Period of the fast trend EMA used for the momentum side of the trend filter. |
| SlowPeriod | 55 | 20 | 200 | Period of the slow trend EMA, which also acts as the price-location gate for the trend. |
| RangePeriod | 14 | 5 | 40 | Lookback (in bars) for the high/low channel that defines the range-position oscillator. |
| EntryZone | 25.0 | 10.0 | 40.0 | Pullback zone threshold on the 0–100 scale. Longs require a dip below this level; shorts a rise above 100 − EntryZone. Smaller values demand a deeper pullback. |
| AtrPeriod | 14 | 7 | 30 | ATR period used for sizing the stop, target, and trailing distance. |
| StopAtrMult | 2.0 | 1.0 | 4.0 | Initial stop distance as a multiple of ATR. |
| RewardRisk | 1.8 | 1.0 | 3.5 | Take-profit distance as a multiple of the initial risk (R). |
| TrailAtrMult | 2.0 | 1.0 | 4.0 | Trailing-stop distance as a multiple of ATR, engaged after break-even. |
| Lots | 0.10 | 0.01 | 1.0 | Fixed position size in lots. |
Recommended Chart Settings
The Range Position Pullback is a single-timeframe strategy: every calculation reads from the chart's own timeframe, so the timeframe is chosen when you attach the Expert Advisor (EA) rather than being fixed in code. Because pullback-continuation logic tends to be clearer on intraday and swing horizons, many traders study it on the H1 (1-hour) or H4 (4-hour) charts of liquid instruments such as major forex pairs (for example EUR/USD or GBP/USD). These timeframes typically offer enough trend persistence for pullbacks to develop while filtering out much of the noise seen on very short timeframes.
There is no universally "correct" symbol or timeframe. The default parameters — a 21/55 EMA pair with a 14-bar range window — are general-purpose starting points. Results will vary considerably across different instruments, timeframes, and market conditions, and any setting should be studied on historical data and a demo account before drawing conclusions.
How to Install on MetaTrader 5
- Download the .ex5 file from the link below
- Copy it to your MT5
MQL5\Expertsfolder - Restart MetaTrader 5 or refresh the Navigator panel
- Drag the EA onto a chart matching the recommended symbol and timeframe
- Configure the input parameters and enable Algo Trading
What to Consider Before Using This EA
Strengths of this approach. The strategy is disciplined by design. By requiring the "dip then reclaim" transition rather than simply reacting to an oscillator extreme, it aims to filter out weak counter-trend chop and late chases. The dual-EMA trend gate keeps it aligned with the dominant direction, and the ATR-anchored stops mean risk adapts automatically to changing volatility. The two-stage trade manager — break-even followed by an ATR trail — introduces a structured way to handle open positions rather than relying on the fixed target alone.
Known limitations. Like all trend-following pullback systems, this strategy depends on trends actually existing. In sideways, range-bound, or highly volatile news-driven markets, the EMA filter may whipsaw, producing entries that reverse quickly. The oscillator can also flash a "reclaim" during a false continuation, and the confirming candle body is a relatively light filter. Because only one position is held at a time, the strategy may miss additional opportunities during strong runs, and the ATR trail can exit prematurely during volatile retracements. Fixed-lot sizing does not scale risk to account equity, which is something to consider carefully.
Where it may underperform. Expect the weakest behavior in tight consolidations, during low-liquidity sessions, and around major economic releases where spreads widen and price gaps. Historically, pullback-continuation logic performs best when a trend is clearly established and worst when direction is ambiguous.
Risk Management Tips
Sound risk management matters more than any single entry rule. Consider the following educational principles:
- Size positions to your account, not to habit. A common guideline is to risk no more than 1–2% of account equity per trade. Because this EA uses a fixed lot size, you may need to adjust the
Lotsinput to keep risk within that band as your balance changes. - Always test on a demo account first. Study the strategy's behavior across different symbols, timeframes, and market regimes before considering any live use.
- Understand drawdown. Every strategy experiences losing streaks. Knowing the potential depth and duration of drawdown helps set realistic expectations and avoid abandoning a plan at the worst moment.
- Account for costs and slippage. Spreads, commissions, and slippage all erode results and can differ meaningfully between backtest and live conditions.
- Never trade money you cannot afford to lose, and consider consulting a qualified financial professional before making decisions.
Risk Warning
Trading foreign exchange, CFDs, and other leveraged financial instruments involves substantial risk of loss and is not suitable for all investors. The strategies and tools discussed on this page are provided for educational purposes only and do not constitute financial advice, investment recommendations, or solicitation to trade. Always consult a qualified financial adviser before making trading decisions. Past backtest performance is not indicative of future results.
Downloads
- Expert Advisor: RangePositionPullback.ex5 (3 downloads)
- Source Code: RangePositionPullback.mq5 (3 downloads)
- Documentation: RangePositionPullback.pdf (3 downloads)