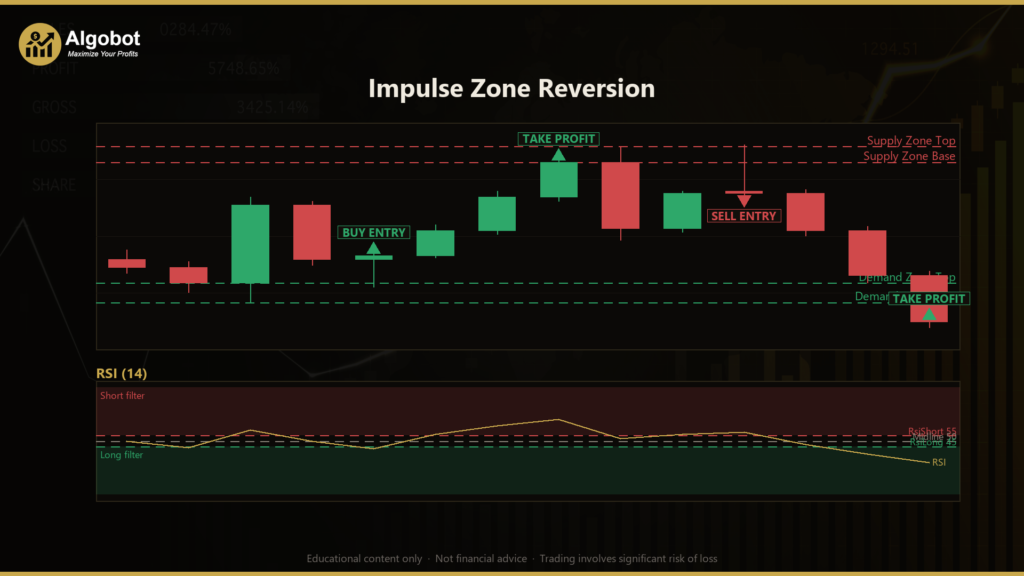
Disclaimer: This article is for educational and informational purposes only. It does not constitute financial or investment advice. Trading forex and CFDs carries significant risk of loss. Past performance of any strategy — including backtests — does not guarantee future results. Never trade with money you cannot afford to lose.
What Is This Strategy?
Impulse Zone Reversion is a supply-and-demand mean-reversion strategy that combines price-action zone mapping with the Relative Strength Index (RSI), a momentum oscillator that measures whether recent price moves have pushed an instrument toward overbought or oversold conditions. Rather than chasing breakouts, this approach waits for price to return to an area where a sharp move originated, then looks for a momentum reading that confirms the move may be exhausted. In short, it is a counter-trend, reaction-based method built around the idea that strong directional candles leave behind imbalances that price often revisits.
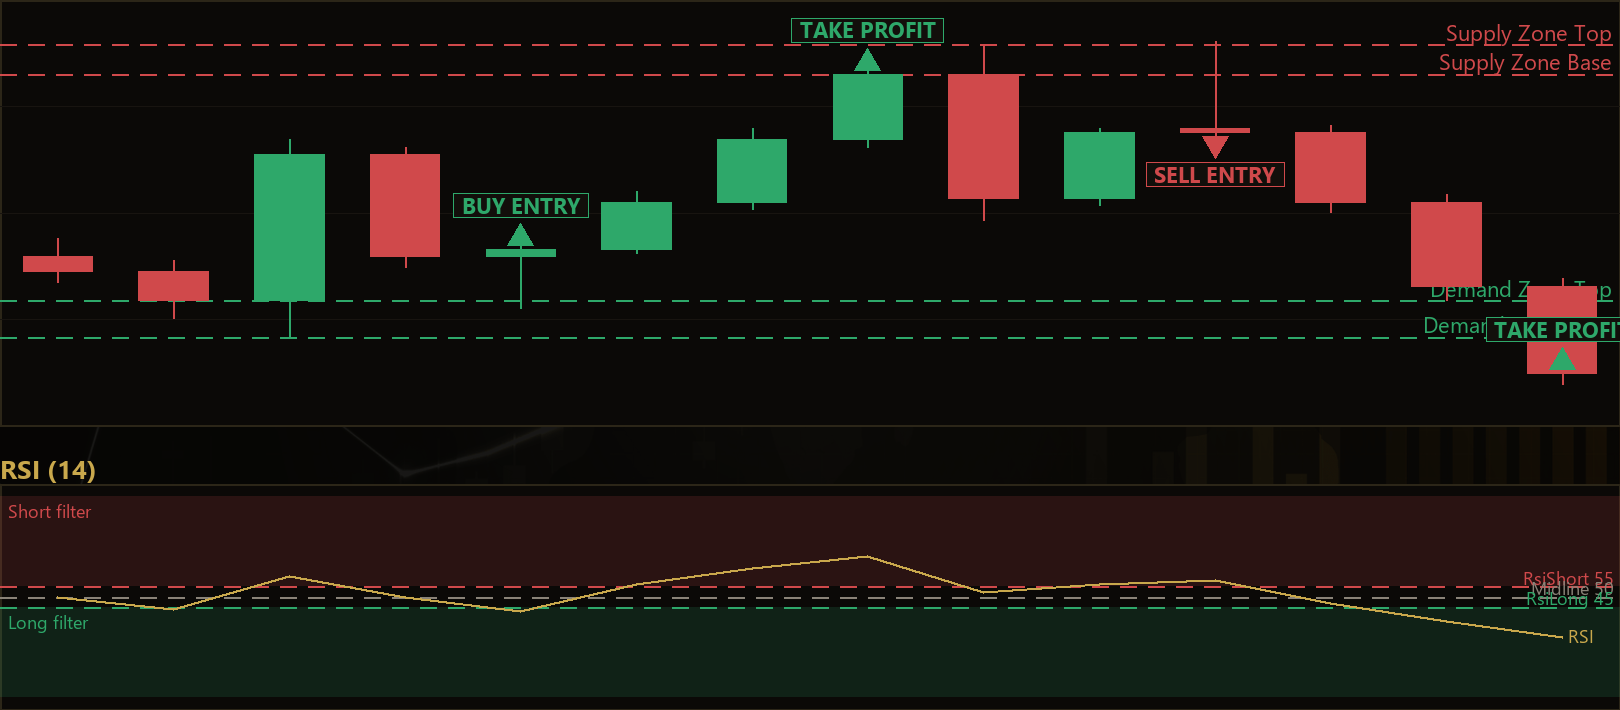
The core concept borrows from institutional "supply and demand" theory. When a single candle pushes hard in one direction — its body exceeding a multiple of the Average True Range (ATR), a volatility gauge — the strategy reads that candle as a footprint of aggressive buying or selling. A powerful bullish candle is interpreted as leaving a demand zone at its origin, while a powerful bearish candle leaves a supply zone. The strategy then watches for price to dip back into one of these fresh zones and react.
This makes Impulse Zone Reversion most relevant as a learning tool for traders who want to study how supply/demand concepts can be expressed in objective, rule-based code. It is designed for ranging or rotational market conditions where price tends to revert toward recent value, rather than strong, sustained trends. If you are exploring how to combine a structural concept (zones) with a confirmation filter (RSI momentum), this strategy offers a compact, readable example. It is not a shortcut — it is a framework for understanding reaction trading.
How It Works
The strategy evaluates its rules once per completed bar on the primary timeframe, which keeps signals stable and avoids reacting to noise inside a forming candle. Here is how each piece fits together:
- Detecting an impulse and stamping a zone: On each closed bar, the strategy measures the candle body (close minus open). If a bullish body is larger than
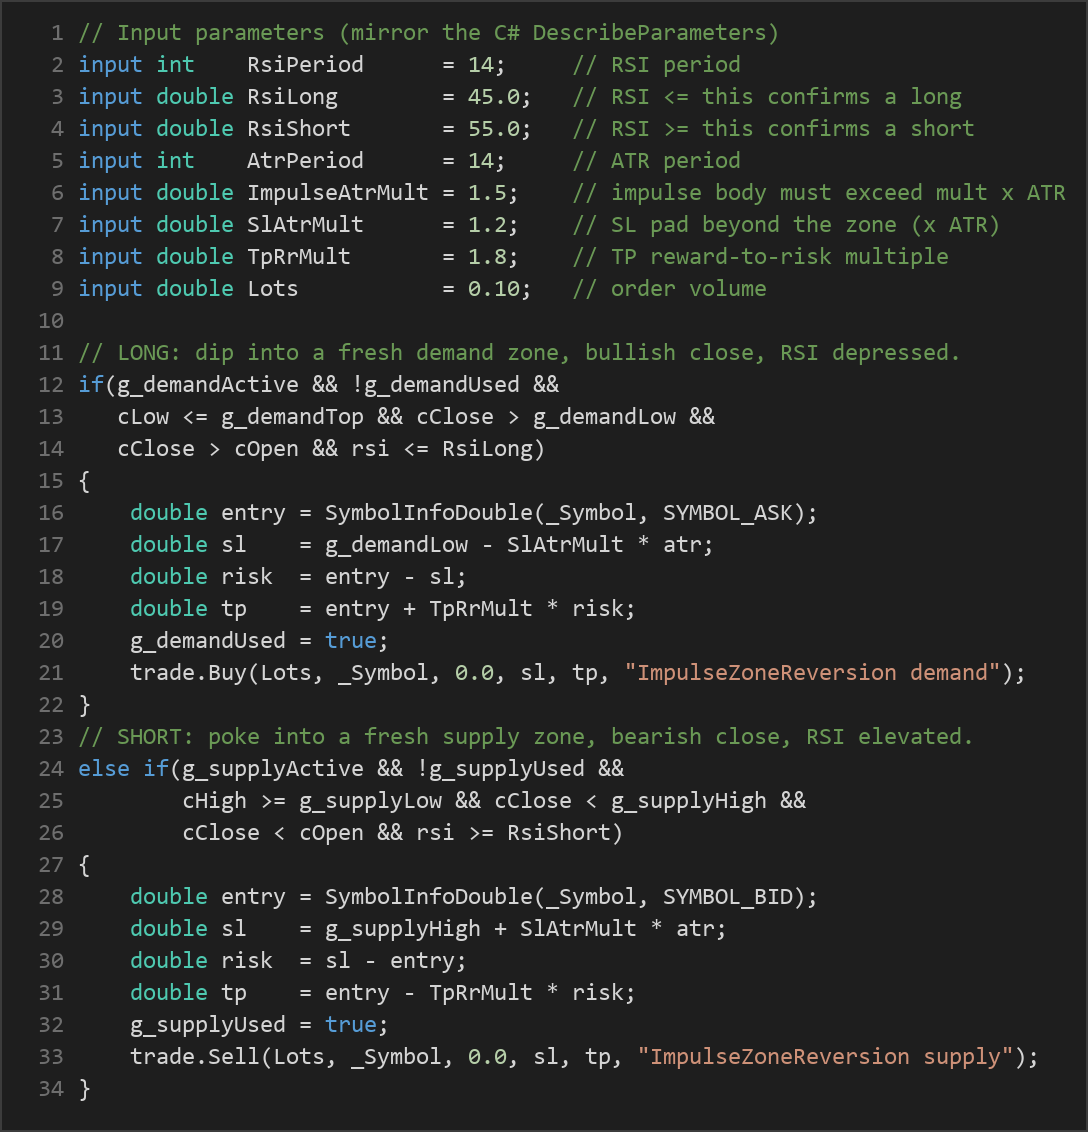
ImpulseAtrMult× ATR, it stamps a fresh demand zone spanning from the candle's Low up to its Open. If a bearish body exceeds the same threshold, it stamps a supply zone spanning from the candle's Open up to its High. Only the most recent demand and supply zone are retained. - Long (buy) signal: When the strategy is flat (no open position), it signals a long if price dips into a fresh, unused demand zone — meaning the bar's Low reaches into the zone — and the bar closes back up inside the zone (a bullish bar), and RSI is depressed at or below the
RsiLongthreshold. This combination may indicate that sellers pushed price into demand but buyers reclaimed control while momentum was low. - Short (sell) signal: Conversely, the strategy signals a short if price pokes up into a fresh, unused supply zone, closes back down (a bearish bar), and RSI is elevated at or above the
RsiShortthreshold. This may indicate a rejection from supply while momentum was stretched. - Stop-loss logic: For a long, the stop is placed below the demand zone's low, padded by
SlAtrMult× ATR. For a short, the stop sits above the supply zone's high, padded by the same ATR multiple. Anchoring the stop to the zone plus a volatility buffer gives the trade room beyond the structural level that justified entry. - Take-profit logic: The target is a fixed reward-to-risk multiple. The strategy measures the distance between entry and stop (the risk), then projects the take-profit at
TpRrMulttimes that distance in the direction of the trade. With the default of 1.8, each unit of risk is paired with 1.8 units of potential reward. - Zone hygiene: A zone is used at most once. The moment price closes through a zone — below a demand zone's low or above a supply zone's high — that zone is discarded as "broken." This filters out attempts to fade moves that have already invalidated the level, keeping signals objective.
Strategy Parameters
| Parameter | Default | Min | Max | Description |
|---|---|---|---|---|
| RsiPeriod | 14 | 5 | 30 | Look-back length for the RSI momentum filter. Shorter values react faster but are noisier. |
| RsiLong | 45.0 | 20.0 | 50.0 | RSI must be at or below this level to confirm a long. Lower values demand a more depressed (oversold) reading. |
| RsiShort | 55.0 | 50.0 | 80.0 | RSI must be at or above this level to confirm a short. Higher values demand a more elevated (overbought) reading. |
| AtrPeriod | 14 | 5 | 30 | Look-back length for the ATR volatility measure used to size impulses and stops. |
| ImpulseAtrMult | 1.5 | 0.8 | 3.0 | How large a candle body must be (× ATR) to qualify as an impulse and stamp a zone. Higher values demand stronger moves. |
| SlAtrMult | 1.2 | 0.5 | 3.0 | ATR padding added beyond the zone when placing the stop-loss. Higher values give the trade more room. |
| TpRrMult | 1.8 | 0.8 | 4.0 | Take-profit reward-to-risk multiple. With 1.8, the target is 1.8× the stop distance. |
| Lots | 0.10 | 0.01 | 1.0 | Fixed order volume per trade. Should be set in proportion to account size and risk tolerance. |
Recommended Chart Settings
This expert advisor reads its primary symbol and timeframe directly from the chart it is attached to, so there is no hard-coded market. Supply/demand reaction strategies like this one are commonly studied on liquid forex pairs such as EUR/USD on intermediate timeframes (for example, M15, M30, or H1), where impulse candles and subsequent revisits are frequent enough to study but not dominated by tick noise. Because the logic is volatility-aware through ATR, it can adapt to different instruments, but the quality of zones varies considerably by symbol and session. Treat any chart as a starting point for testing, and remember that results will vary across different market conditions, spreads, and broker feeds.
How to Install on MetaTrader 5
- Download the .ex5 file from the link below
- Copy it to your MT5
MQL5\Expertsfolder - Restart MetaTrader 5 or refresh the Navigator panel
- Drag the EA onto a chart matching the recommended symbol and timeframe
- Configure the input parameters and enable Algo Trading
What to Consider Before Using This EA
The strength of Impulse Zone Reversion lies in its discipline. It only acts on clearly defined impulses, requires both structural and momentum confirmation, and refuses to re-use a zone or fade a level that price has already broken. This objectivity removes much of the discretion that makes manual supply/demand trading inconsistent, which makes it a useful study tool for understanding how a reaction setup can be codified.
That said, mean-reversion approaches have well-known limitations. The biggest is trending markets: when price breaks through a zone and keeps going, the strategy's "buy the dip" or "sell the rally" logic can be repeatedly invalidated. The zone-broken filter helps, but it acts after the fact. RSI thresholds can also stay stretched for long periods during strong trends, delaying or suppressing signals at exactly the wrong time. Additionally, because only the single most recent demand and supply zone are retained, the strategy may overlook older levels that price ultimately respects. Slippage, wide spreads, and gaps around news can further distort entries near zone edges. None of these flaws make the approach invalid — they simply define the conditions where it may underperform and underscore why testing matters.
Risk Management Tips
Sound risk management matters more than any single parameter setting. Consider these general principles as you study this strategy:
- Risk a small, fixed fraction per trade. Many educators suggest never risking more than 1–2% of account equity on a single position. Set the
Lotsvalue so that the distance to your stop represents only that small fraction of your balance. - Understand drawdown. Even a well-designed strategy will experience losing streaks. Review the maximum historical drawdown in testing so you know what a normal rough patch looks like before it happens live.
- Always start on a demo account. Run the EA in a risk-free simulated environment first to observe how it behaves across different sessions and volatility regimes before committing real capital.
- Match position size to volatility. Because stops here scale with ATR, the same
Lotsvalue can represent very different monetary risk on calm versus volatile days. Recalculate as conditions change. - Avoid over-optimization. Tuning parameters to fit past data perfectly often produces fragile results. Favor robust settings that work reasonably across a range of conditions.
Risk Warning
Trading foreign exchange, CFDs, and other leveraged financial instruments involves substantial risk of loss and is not suitable for all investors. The strategies and tools discussed on this page are provided for educational purposes only and do not constitute financial advice, investment recommendations, or solicitation to trade. Always consult a qualified financial adviser before making trading decisions. Past backtest performance is not indicative of future results.
Downloads
- Expert Advisor: ImpulseZoneReversion.ex5 (58 downloads)
- Source Code: ImpulseZoneReversion.mq5 (56 downloads)
- Documentation: ImpulseZoneReversion.pdf (58 downloads)