Disclaimer: This article is for educational and informational purposes only. It does not constitute financial or investment advice. Trading forex and CFDs carries significant risk of loss. Past performance of any strategy — including backtests — does not guarantee future results. Never trade with money you cannot afford to lose.
What Is This Strategy?
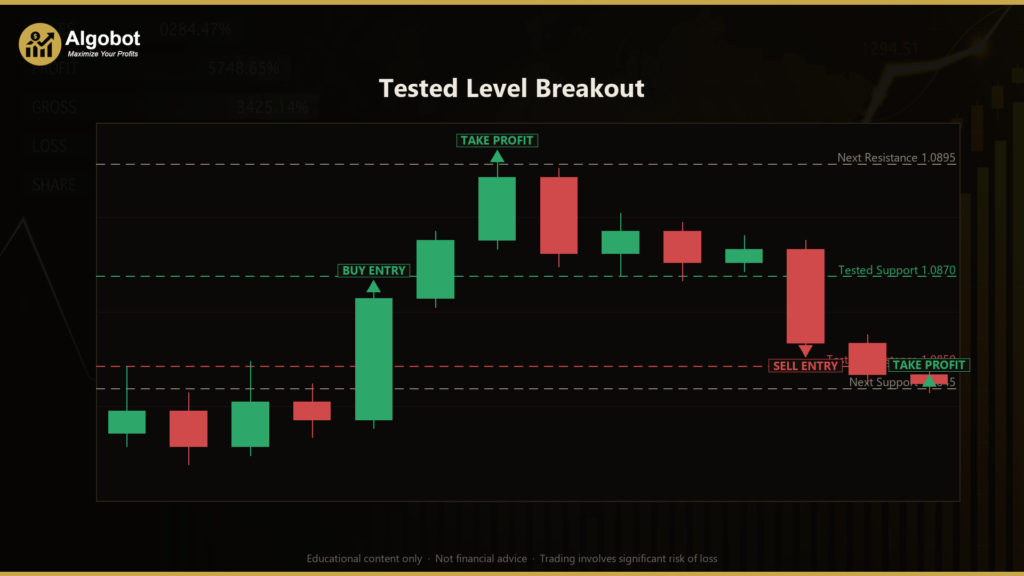
The Tested Level Breakout strategy is a price-action breakout system for MetaTrader 5 that combines objective support and resistance mapping with a momentum-expansion filter. Rather than relying on oscillators or moving-average crossovers, it builds its trade logic entirely from the raw structure of the chart: horizontal levels drawn from confirmed swing pivots, and the size of the candle that finally breaks one of them. A swing pivot, in this context, is simply a turning point — a bar whose high (or low) stands above (or below) the bars on either side of it.
The core idea is that not all support and resistance lines are equal. A level that price has visited and respected several times is more meaningful than one drawn from a single random spike. This strategy quantifies that idea by counting how many times each level has been "touched" before it is allowed to generate a trade. It then waits for a decisive, high-range candle to push through the level, treating that expansion as evidence that real momentum — not a marginal poke — is behind the move.
As a learning tool, Tested Level Breakout suits traders who want to study how support/resistance breakouts and volatility expansion can be expressed as objective, rule-based code. It is designed for trending or range-then-trend market conditions, where a well-tested shelf finally gives way and price travels to the next structural level. It is not a high-frequency system; it trades one position at a time and only when several conditions align. Treat it as a framework for understanding breakout mechanics rather than a finished product.
How It Works
The strategy processes one newly closed bar at a time and maintains two evolving maps of price structure: a list of resistance levels (from swing highs) and a list of support levels (from swing lows). All distances are scaled by the Average True Range (ATR), a measure of recent volatility, so the logic adapts to fast and slow markets alike.
Building and testing levels:
- When a bar is confirmed as a strict swing high (its high is the unique maximum across the
Fractalbars on each side), it registers a new resistance level. The mirror condition registers a support level from a swing low. - If a new pivot lands within an ATR-scaled tolerance (
TolAtrMult) of an existing level, it is merged into that level instead of creating a duplicate. Each merge nudges the stored price toward the average and increments the level's touch count. - A level becomes tradable only once its touch count reaches
MinTouches. This is how the strategy distinguishes a respected shelf from a one-off spike. - Stale levels are removed after
LevelLifetimebars without a fresh touch, keeping the map relevant to current price action.
Entry conditions — the strategy signals a trade when:
- The just-closed bar shows volatility expansion: its range (high minus low) is at least
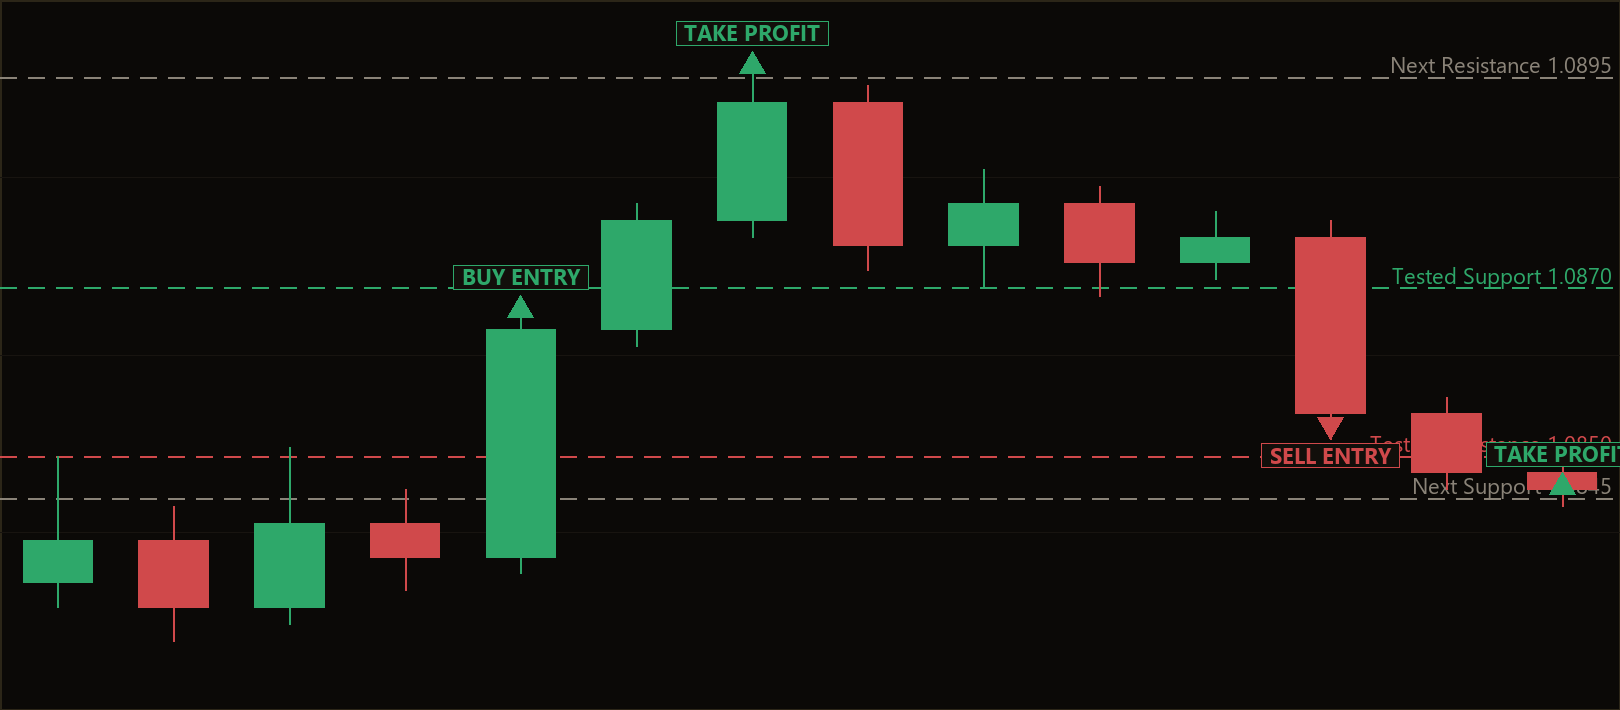
ExpAtrMult× ATR. Without this expansion, no trade is considered. - Buy signal: price sat at or below a tested resistance on the prior close, and the just-closed bar closes clear above that level by an ATR break-buffer (
BreakBuffer). If several tested levels are cleared at once, the strongest (highest) one is chosen. - Sell signal: the exact mirror — price sat at or above a tested support, and the just-closed bar closes clear below it by the same buffer. The lowest cleared shelf is chosen.
Stop-loss logic:
- For a buy, the stop is placed just below the broken level or the breakout bar's low (whichever is lower), minus the ATR buffer.
- For a sell, the stop sits just above the broken level or the breakout bar's high, plus the buffer.
- This anchors risk to genuine structure rather than an arbitrary fixed distance.
Take-profit logic:
- The preferred target is the next mapped level in the breakout direction (level-to-level travel) — the idea being that price often runs from one shelf to the next.
- If no further level exists, or the next level is closer than one unit of risk (1R), the strategy falls back to a fixed reward-to-risk target defined by
RewardRisk.
Only one position is held at a time, and a level that has been broken is flipped off the map so it cannot immediately re-trigger.
Strategy Parameters
| Parameter | Default | Min | Max | Description |
|---|---|---|---|---|
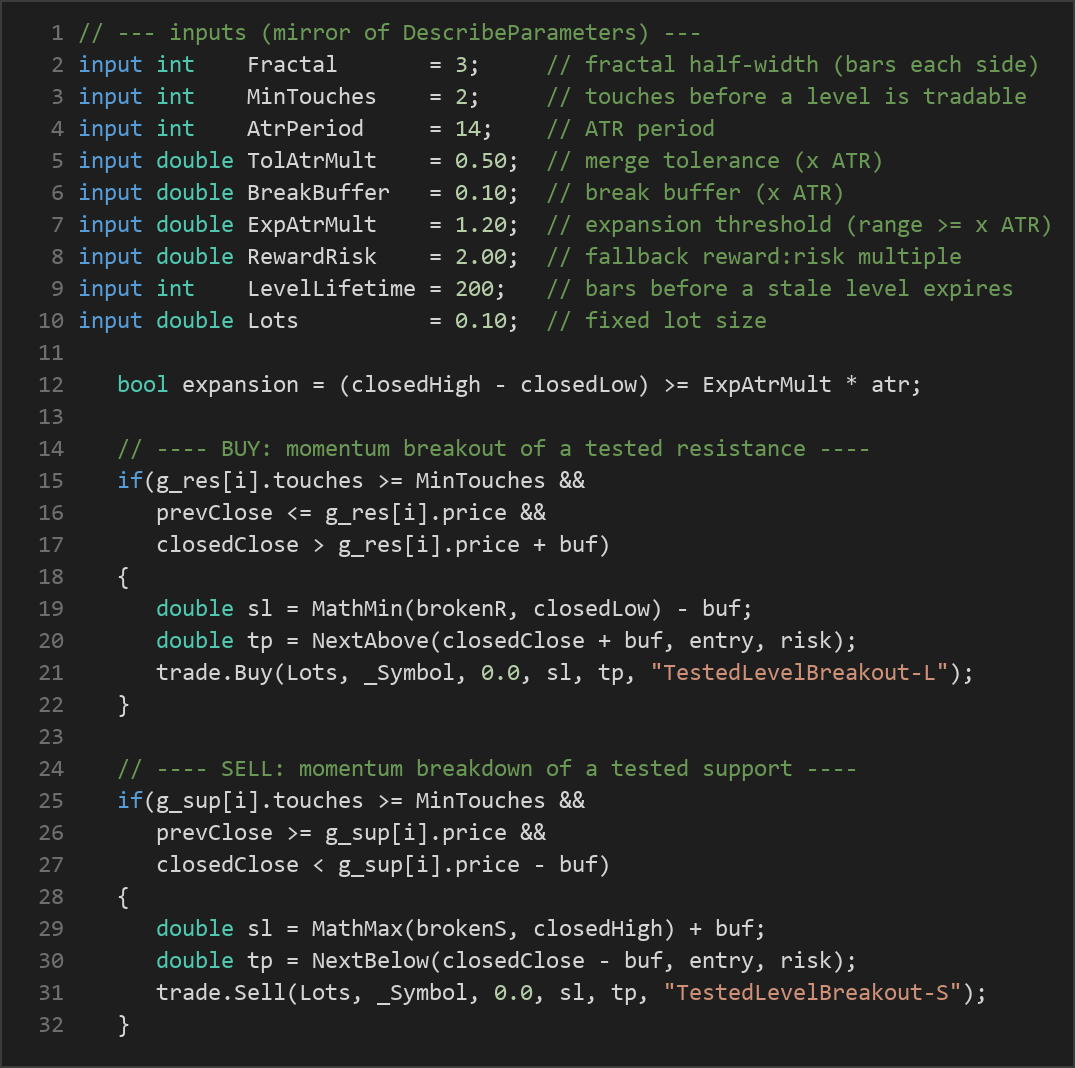
| Fractal | 3 | 2 | 6 | Half-width of the swing pivot — number of bars required on each side for a high/low to qualify as a level. |
| MinTouches | 2 | 1 | 4 | How many times a level must be touched before it becomes eligible to trade. |
| AtrPeriod | 14 | 7 | 28 | Lookback period for the ATR that scales tolerance, buffers, and expansion. |
| TolAtrMult | 0.50 | 0.10 | 1.50 | Merge tolerance (× ATR) — how close a new pivot must be to fold into an existing level. |
| BreakBuffer | 0.10 | 0.00 | 0.50 | Break buffer (× ATR) — extra distance a close must clear to confirm a breakout and filter marginal pokes. |
| ExpAtrMult | 1.20 | 0.80 | 2.50 | Expansion threshold — the breakout bar's range must be at least this multiple of ATR. |
| RewardRisk | 2.00 | 1.00 | 4.00 | Fallback reward-to-risk multiple used when no further level provides a target. |
| LevelLifetime | 200 | 50 | 500 | Number of bars before a stale, untouched level expires from the map. |
| Lots | 0.10 | 0.01 | 1.00 | Fixed trade volume in lots. |
Recommended Chart Settings
This strategy was designed as a single-timeframe system and works on whichever symbol and timeframe you attach it to. A common starting point for studying breakout behavior is a liquid major forex pair (for example EUR/USD or GBP/USD) on an intermediate timeframe such as H1 or H4, where swing structure is clear and ATR-based filters have enough room to be meaningful. Higher timeframes tend to produce fewer but more structurally significant levels, while lower timeframes generate more signals with more noise.
Because every threshold in the logic is scaled by ATR, the strategy adapts to the volatility of whatever instrument you test. That said, results will vary considerably across different symbols, sessions, and market regimes. Always test on the specific instrument and timeframe you intend to study before drawing any conclusions.
How to Install on MetaTrader 5
- Download the
.ex5file from the link below. - Copy it to your MT5
MQL5\Expertsfolder. - Restart MetaTrader 5 or refresh the Navigator panel.
- Drag the EA onto a chart matching the recommended symbol and timeframe.
- Configure the input parameters and enable Algo Trading.
What to Consider Before Using This EA
The strength of the Tested Level Breakout approach is its objectivity. Support and resistance are notoriously subjective when drawn by hand; here they are derived mechanically from confirmed pivots and validated by a touch count, which removes a great deal of guesswork. Pairing that with a volatility-expansion filter means the system historically tries to avoid the most common breakout trap — the slow, low-energy drift through a level that immediately reverses.
However, every breakout method has well-known limitations. False breakouts remain the central challenge: price can close decisively beyond a tested level on the breakout bar and then snap back, hitting the stop. The ATR break-buffer and expansion filter reduce but cannot eliminate these. In choppy, range-bound conditions, the strategy may repeatedly arm and trigger on levels that fail to hold, producing a string of small losses. Conversely, in a strong, smoothly trending market with few sharp pivots, qualifying levels may be sparse and signals infrequent.
There are also structural trade-offs to understand. Confirming a pivot requires Fractal bars to close on each side, so levels are always recognized with a lag. The level-to-level take-profit assumes the next mapped shelf is a realistic objective, which is not guaranteed when structure is thin. And because the system holds only one position at a time, it can miss opportunities while a trade is open. None of these are flaws so much as characteristics — understanding them is part of using the tool responsibly.
Risk Management Tips
Sound risk management matters more than any single entry rule. Consider these general principles as you study the strategy:
- Risk a small, fixed fraction per trade. Many educational sources suggest never risking more than 1–2% of account equity on any one position. Because this EA uses a fixed
Lotsvalue rather than dynamic sizing, you should calculate whether that lot size keeps your per-trade risk within your chosen limit on your specific account. - Always start on a demo account. Run the strategy in simulation until you understand how it behaves across different conditions before considering any live capital.
- Understand drawdown. A sequence of losing trades is normal for any breakout system. Know the maximum losing streak and equity dip you are prepared to tolerate in advance.
- Account for costs. Spread, slippage, and commission can meaningfully affect breakout strategies, since entries often occur during fast-moving bars.
- Avoid over-optimization. Tuning parameters until a backtest looks perfect ("curve fitting") rarely survives in live markets. Prefer settings that are robust across a range of values.
Risk Warning
Trading foreign exchange, CFDs, and other leveraged financial instruments involves substantial risk of loss and is not suitable for all investors. The strategies and tools discussed on this page are provided for educational purposes only and do not constitute financial advice, investment recommendations, or solicitation to trade. Always consult a qualified financial adviser before making trading decisions. Past backtest performance is not indicative of future results.
Downloads
- Expert Advisor: TestedLevelBreakout.ex5 (49 downloads)
- Source Code: TestedLevelBreakout.mq5 (57 downloads)
- Documentation: TestedLevelBreakout.pdf (65 downloads)