Disclaimer: This article is for educational and informational purposes only. It does not constitute financial or investment advice. Trading forex and CFDs carries significant risk of loss. Past performance of any strategy — including backtests — does not guarantee future results. Never trade with money you cannot afford to lose.
What Is This Strategy?
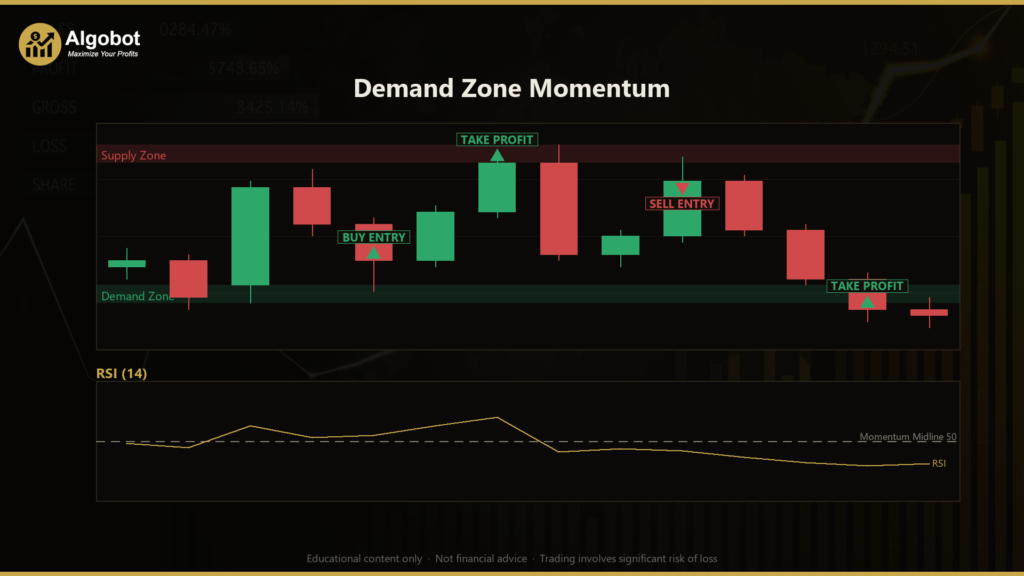
Demand Zone Momentum is a supply-and-demand trading strategy that pairs institutional "zone" mapping with an RSI (Relative Strength Index) momentum filter. RSI is a classic oscillator that measures the speed and direction of recent price changes on a scale of 0 to 100, and this strategy uses it as a confirmation tool rather than a standalone signal. The trading style is reactive and zone-based: instead of chasing breakouts, it waits for price to return to a previously identified area of imbalance before considering an entry.
The core idea borrows from the way large orders are thought to move markets. When a single strong candle — an "impulse" — leaves an imbalance behind, the origin of that move can act as a fresh demand zone (after a bullish impulse) or a fresh supply zone (after a bearish impulse). The theory is that unfilled institutional interest may still sit at that origin, so when price later pulls back into the zone, it can react. The problem with trading zones in isolation is that price often slices straight through stale levels. Demand Zone Momentum addresses this by requiring RSI to already be rotating back in the trend direction before any trade is taken — a filter designed to skip many of the false touches.
As a learning tool, this strategy is well suited to traders who want to study how confluence works: combining a price-structure concept (zones) with an indicator-based confirmation (momentum). It is fully symmetric, meaning the long and short logic mirror each other exactly, which makes it easier to reason about. This is presented here as a strategy analysis for educational study, not as a profit opportunity.
How It Works
The strategy runs on a single timeframe — whichever chart it is attached to — and all logic is evaluated once per closed bar, never on an unfinished candle. Here is the step-by-step flow:
- Zone creation (the impulse): On each newly closed bar, the strategy measures the candle's body (close minus open). If the body is at least
ImpulseAtrMulttimes the current ATR (Average True Range, a volatility measure), the candle is treated as a strong impulse. A bullish impulse stamps a new demand zone; a bearish impulse stamps a new supply zone. - Zone boundaries: For a bullish (demand) zone, the proximal edge is the candle's open and the distal edge is the candle's low. For a bearish (supply) zone, the proximal edge is the open and the distal edge is the high. This "body base" definition keeps the zone tight to where the impulse originated.
- Zone aging: Each active zone has an age counter. Once a zone's age exceeds
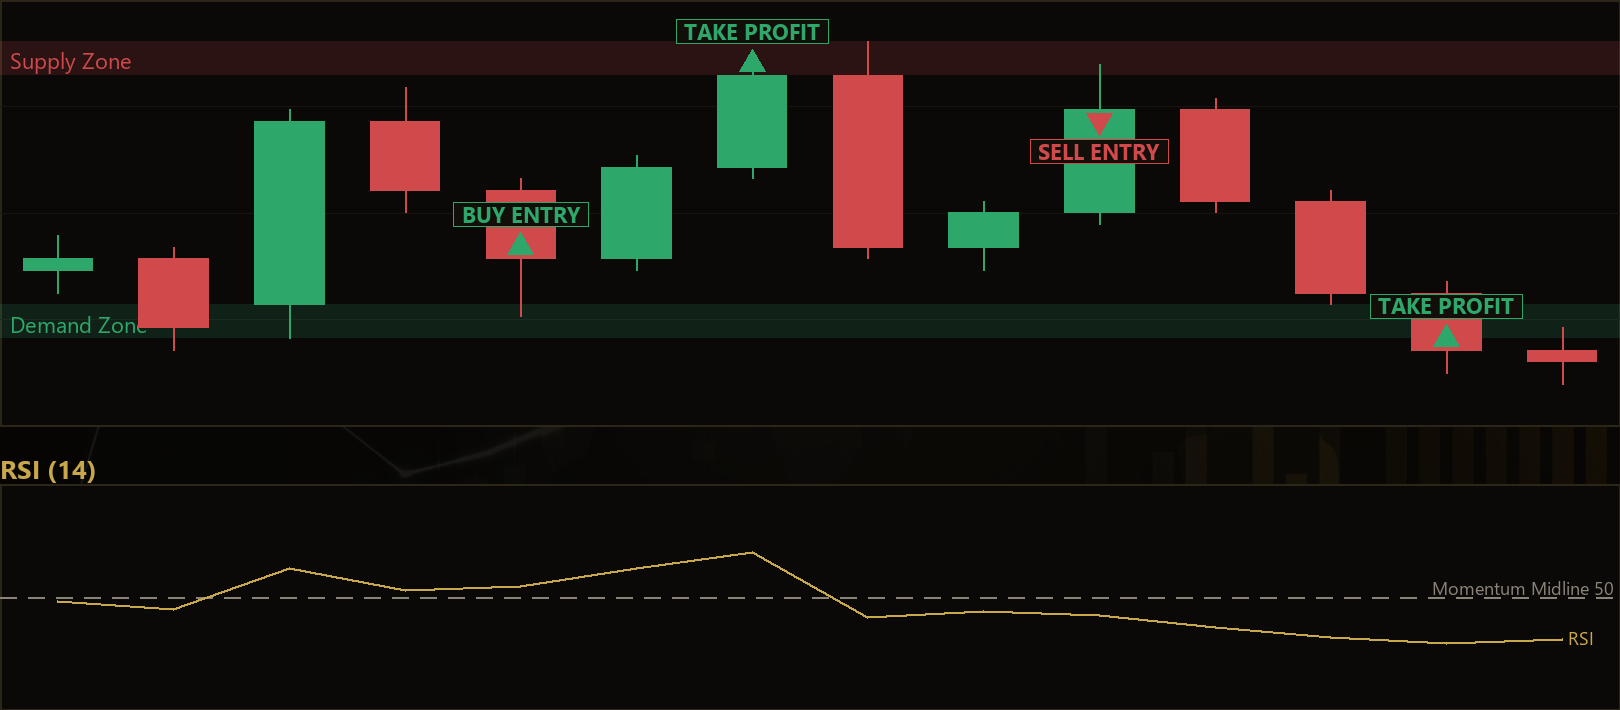
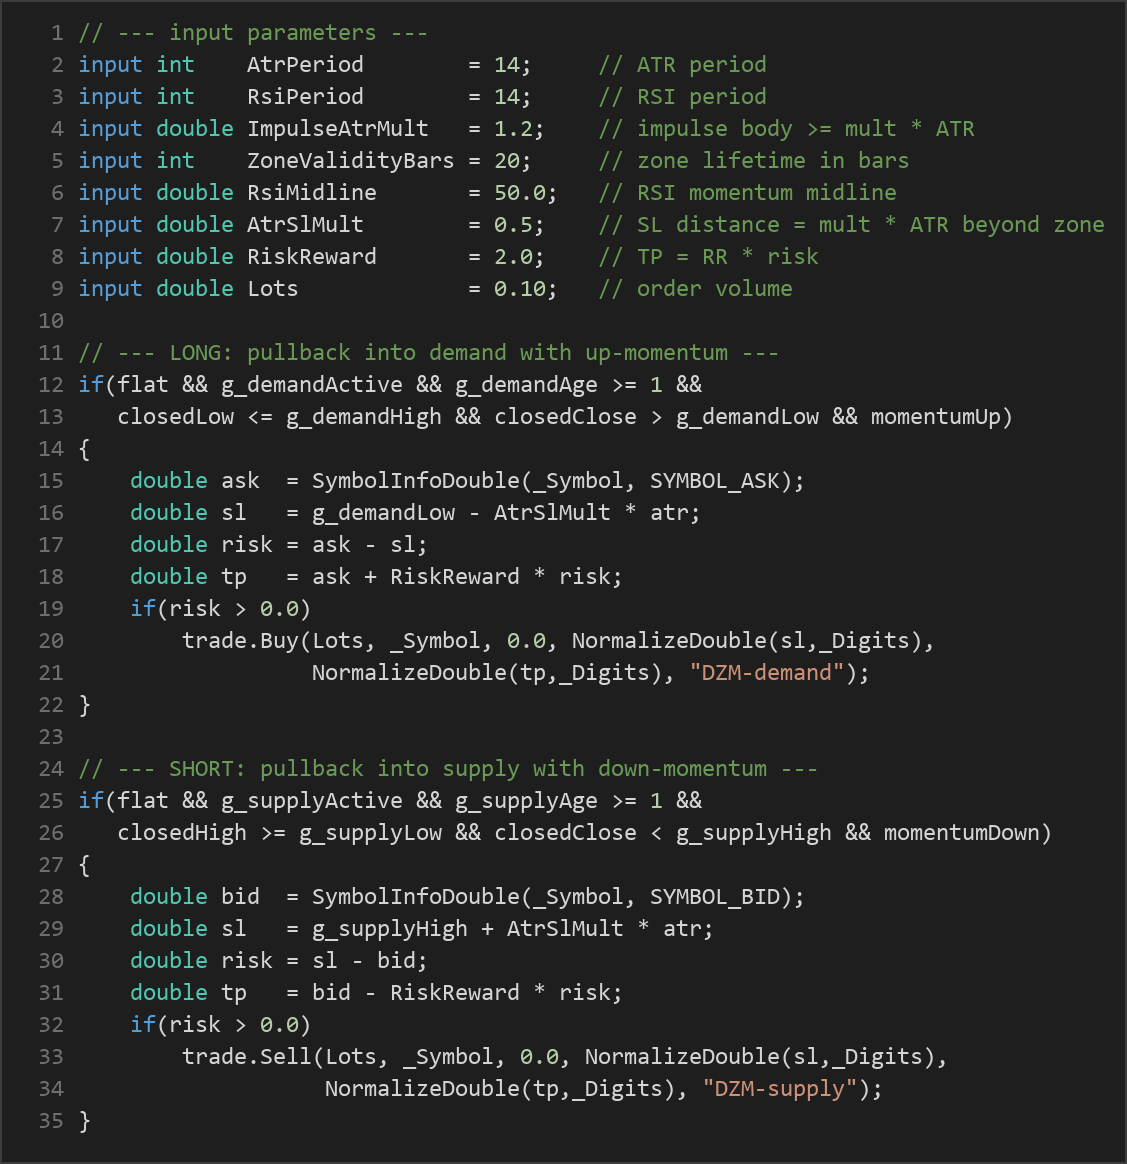
ZoneValidityBars, it is retired as stale and can no longer trigger a trade. A freshly stamped zone is skipped on its creation bar, so price must have a chance to pull away and come back. - Long entry signal: The strategy signals a potential buy when it is flat (no open position for its magic number), a demand zone is active, price has dipped into the zone (the bar's low reached the proximal edge while the close held above the distal edge), and RSI momentum is up — meaning RSI is above the
RsiMidlineand rising versus the prior bar. - Short entry signal: The mirror image. The strategy signals a potential sell when flat, a supply zone is active, price has pushed up into the zone, and RSI momentum is down — RSI below the midline and falling versus the prior bar.
- Stop-loss logic: For longs, the stop is placed below the demand zone's distal low by
AtrSlMulttimes ATR. For shorts, the stop sits above the supply zone's distal high by the same ATR-scaled buffer. This adapts the stop distance to current volatility rather than using a fixed pip value. - Take-profit logic: The target is set using a fixed reward-to-risk ratio. The strategy measures the risk (entry-to-stop distance) and projects the take-profit at
RiskRewardtimes that distance in the trade's favor. - One trade per zone: When a zone produces a trade, it is immediately consumed and deactivated, so the same zone cannot fire twice.
Strategy Parameters
| Parameter | Default | Min | Max | Description |
|---|---|---|---|---|
| AtrPeriod | 14 | 8 | 30 | Lookback length for the ATR volatility measure used to size impulses and stops. |
| RsiPeriod | 14 | 7 | 21 | Lookback length for the RSI momentum oscillator. |
| ImpulseAtrMult | 1.2 | 0.6 | 2.5 | How large a candle body (in ATR multiples) must be to count as an impulse and create a zone. |
| ZoneValidityBars | 20 | 5 | 60 | How many bars a zone stays active before it is retired as stale. |
| RsiMidline | 50.0 | 40.0 | 60.0 | The RSI level that separates "up" momentum from "down" momentum. |
| AtrSlMult | 0.5 | 0.1 | 1.5 | Extra stop-loss distance beyond the zone, expressed as a multiple of ATR. |
| RiskReward | 2.0 | 1.0 | 4.0 | Take-profit distance as a multiple of the entry-to-stop risk. |
| Lots | 0.10 | 0.01 | 1.0 | Fixed order volume (lot size) per trade. |
Recommended Chart Settings
Demand Zone Momentum is timeframe-agnostic by design — every calculation uses the timeframe of the chart it is attached to. This makes it a flexible candidate for experimentation across multiple timeframes during backtesting. A common starting point for supply-and-demand study is a liquid major forex pair such as EUR/USD on an intraday timeframe like M15 or H1, where impulse candles and pullbacks are frequent enough to generate signals but not so noisy that ATR loses meaning. Because the strategy depends on clean impulse moves and orderly pullbacks, its behavior will vary considerably across instruments and market conditions. Always test any combination on historical data first and treat the defaults as a baseline to study, not a finished configuration.
How to Install on MetaTrader 5
- Download the .ex5 file from the link below
- Copy it to your MT5
MQL5\Expertsfolder - Restart MetaTrader 5 or refresh the Navigator panel
- Drag the EA onto a chart matching the recommended symbol and timeframe
- Configure the input parameters and enable Algo Trading
What to Consider Before Using This EA
The main strength of this approach is its discipline. By requiring both a structural condition (a fresh, un-aged zone) and a momentum condition (RSI rotating in the trade's direction), it filters out many of the random zone touches that trip up simpler supply-and-demand systems. The ATR-based stops and fixed reward-to-risk targets also keep the trade-management rules consistent and volatility-aware, which is useful for objective study.
There are real limitations to understand. Supply-and-demand zones are an interpretive concept, and this strategy's tight "body base" definition is just one of many valid ways to draw them — it may miss reactions that occur at the wider candle wicks. The RSI momentum filter helps in trending or rotating conditions but can lag in sharp reversals, and it may keep the strategy on the sidelines during otherwise valid setups. In choppy, low-volatility ranges, impulses that clear the ATR threshold become rare, so signals may be infrequent. Conversely, during violent news-driven moves, price can blow straight through a zone and hit the stop. Like all single-timeframe systems, it has no higher-timeframe context to tell it whether a zone aligns with the broader trend. Treat it as one framework among many, not a complete trading plan.
Risk Management Tips
Sound risk management matters more than any single entry rule. Consider these general principles as you study this or any strategy:
- Position sizing: Size each trade so that a loss at the stop costs only a small, predefined fraction of your account. A widely taught guideline is to risk no more than 1–2% of your capital per trade.
- Use a demo account first: Run the strategy on a demo or paper account until you understand how it behaves across different sessions and conditions before risking real capital.
- Understand drawdown: Even a well-designed strategy will experience losing streaks. Know the historical maximum drawdown of any approach and ask yourself whether you could sit through it without abandoning the plan.
- Mind the fixed lot size: The default uses a fixed lot size, which does not scale risk to volatility or account size. Adjust it deliberately to match your own risk tolerance.
- Avoid over-optimization: Tuning parameters until a backtest looks perfect ("curve fitting") tends to produce results that may not hold up on new data. Favor robust, stable settings over fragile ones.
Risk Warning
Trading foreign exchange, CFDs, and other leveraged financial instruments involves substantial risk of loss and is not suitable for all investors. The strategies and tools discussed on this page are provided for educational purposes only and do not constitute financial advice, investment recommendations, or solicitation to trade. Always consult a qualified financial adviser before making trading decisions. Past backtest performance is not indicative of future results.
Downloads
- Expert Advisor: DemandZoneMomentum.ex5 (56 downloads)
- Source Code: DemandZoneMomentum.mq5 (59 downloads)
- Documentation: DemandZoneMomentum.pdf (52 downloads)