Disclaimer: This article is for educational and informational purposes only. It does not constitute financial or investment advice. Trading forex and CFDs carries significant risk of loss. Past performance of any strategy — including backtests — does not guarantee future results. Never trade with money you cannot afford to lose.
What Is This Strategy?
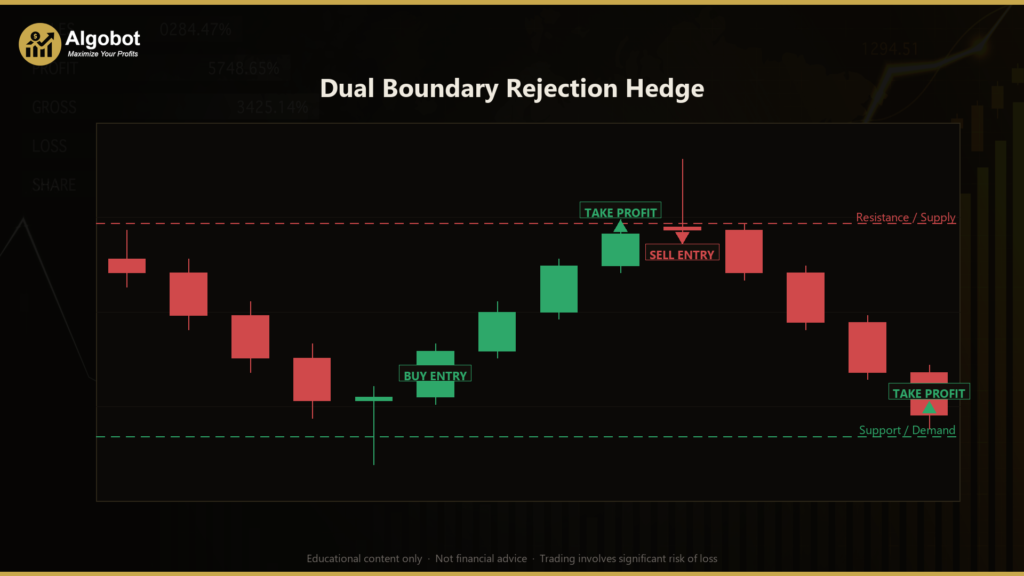
The Dual Boundary Rejection Hedge is a pure price-action range-trading strategy built around candlestick rejection patterns (often called pin bars or long-wick candles) at support and resistance boundaries. It uses no traditional indicators — no moving averages, no RSI, no MACD. Instead, it reads raw price structure: it maps a rolling support/demand floor and a resistance/supply ceiling from recent swing highs and lows, then looks for a candle that pierces one of those boundaries and snaps back inside, leaving a long rejection wick behind.
This approach is designed for ranging or consolidating markets — periods when price oscillates between a well-defined floor and ceiling rather than trending strongly in one direction. In those conditions, boundaries tend to hold, and rejection candles can mark the points where price turns away from the edge of the range. The strategy "fades" the move, meaning it trades against the test of the boundary in anticipation of a bounce back toward the middle of the range.
The defining twist is the built-in hedge. Ranges do not last forever, and sometimes a boundary that looks like support or resistance simply breaks. When that happens, the strategy does not just take the loss passively — it opens an opposing position in the direction of the breakout, attempting to recover from (and potentially profit on) the very move that invalidated the original fade. This makes the Dual Boundary Rejection Hedge a useful learning tool for anyone studying how support and resistance, candlestick rejection patterns, and hedging mechanics can be combined inside a single automated system. It is best treated as a study piece for understanding range behavior, not as a turnkey solution.
How It Works
The strategy evaluates the market once per completed bar, using the last fully-closed candle as its "signal bar." Before looking for any trade, it builds a range from the bars sitting behind the signal bar.
Building the range:
- It scans a window of recent completed bars (set by
RangeLookback) sitting behind the signal candle. - The highest high in that window becomes the resistance / supply ceiling.
- The lowest low becomes the support / demand floor.
- It also computes the average bar range over the window, which is used to size a "buffer" zone around each boundary.
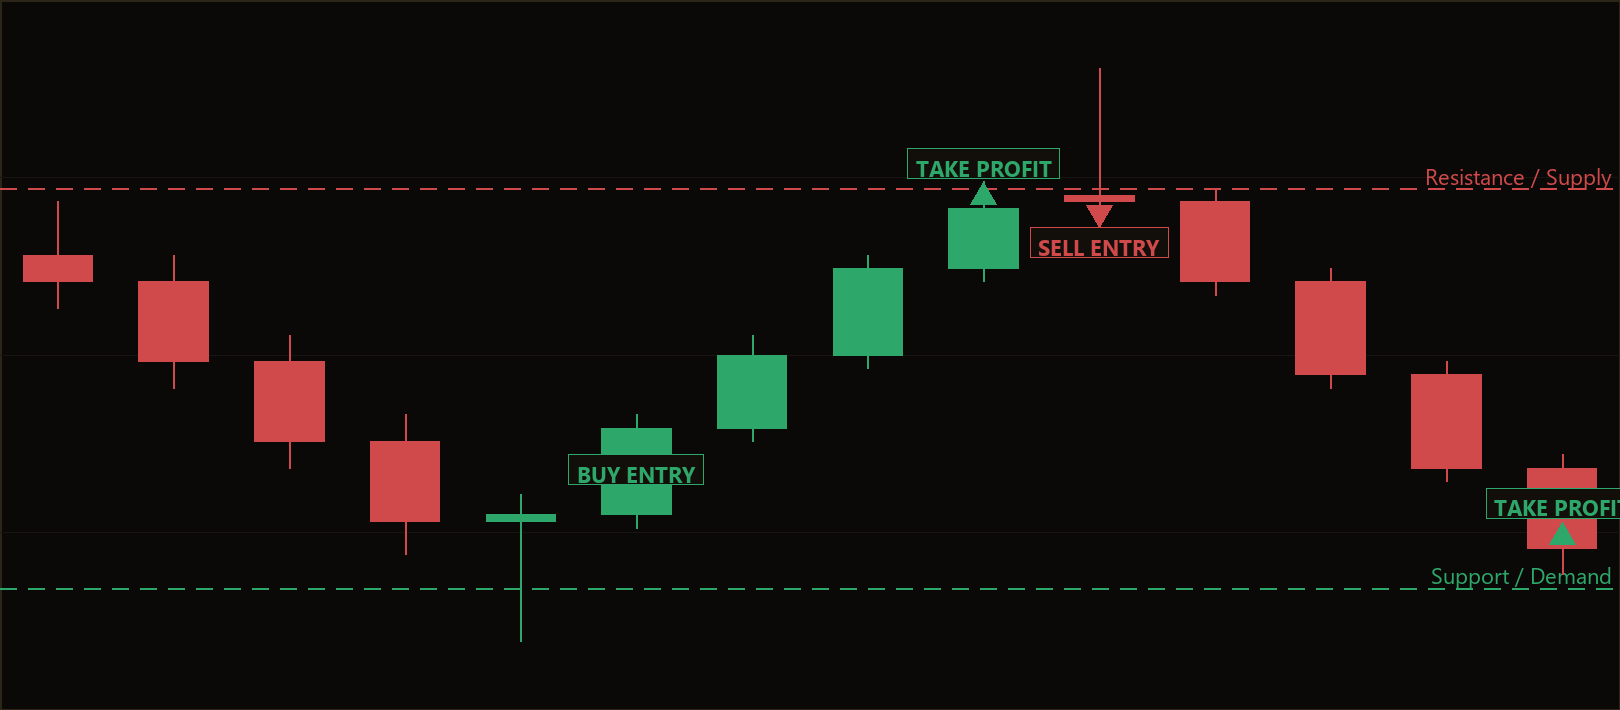
Long (buy) entry — the strategy signals a bullish rejection at support when:
- The signal candle's low pierces into the demand zone (dips to or below support plus the buffer).
- The candle still closes back above support — price was rejected back inside the range.
- The candle is bullish (closes above its open).
- The lower wick is large relative to the candle's full range (at least
WickFractionof it), confirming a pin-bar style rejection.
Short (sell) entry — the strategy signals a bearish rejection at resistance when:
- The signal candle's high pierces into the supply zone (reaches resistance minus the buffer).
- The candle closes back below resistance.
- The candle is bearish (closes below its open).
- The upper wick is large relative to the candle's range (at least
WickFraction).
Stop-loss logic:
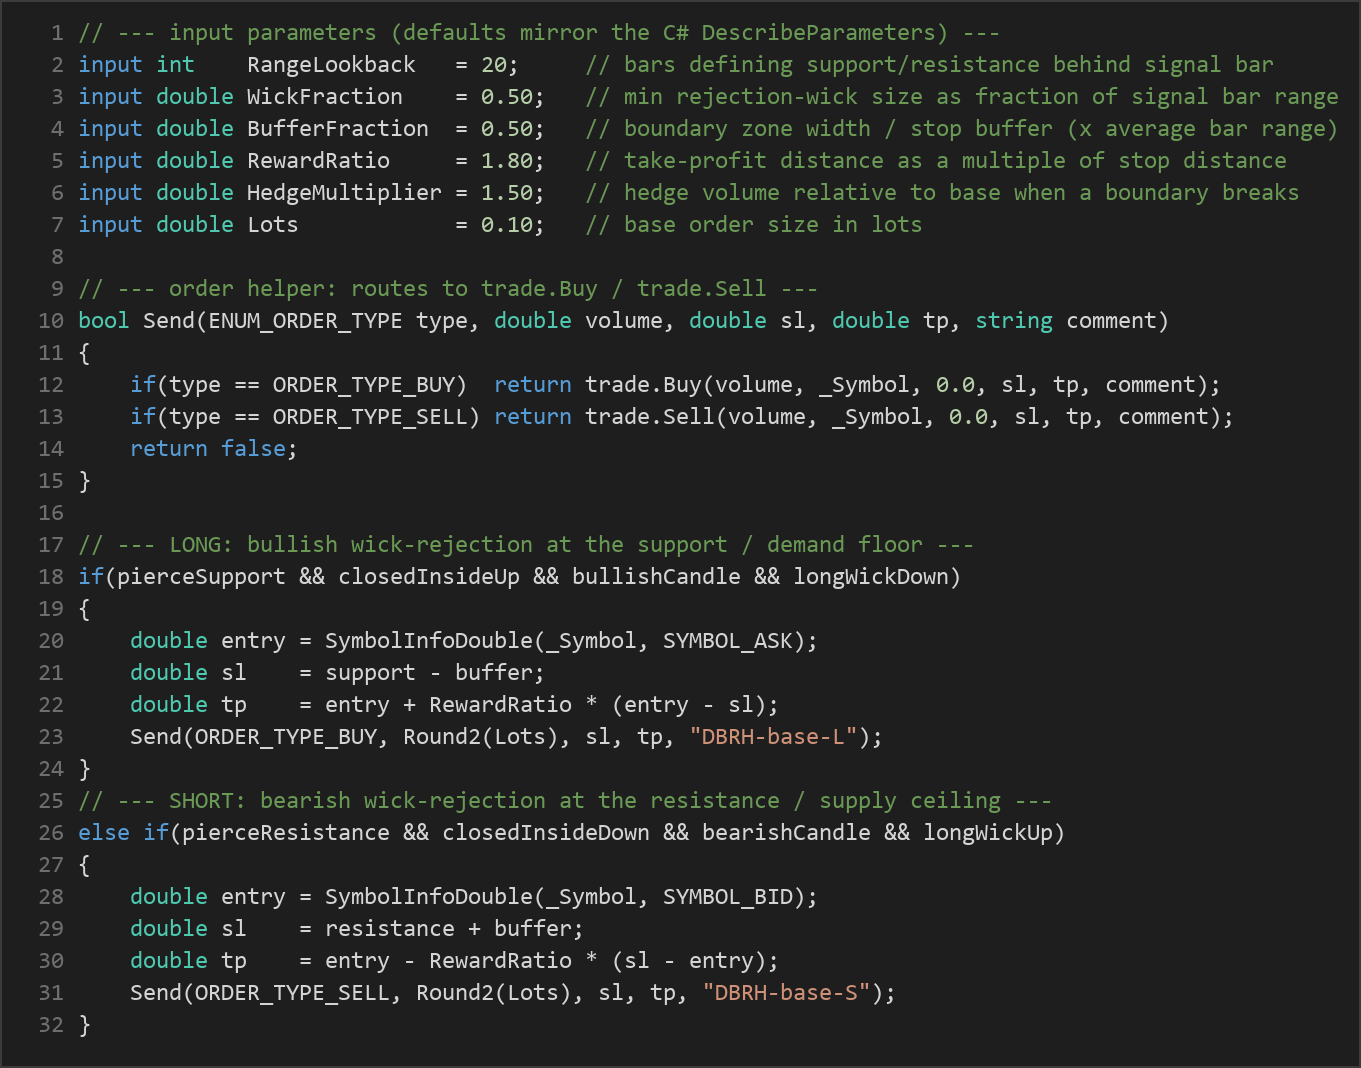
- For a long fade, the stop is placed just below the support floor (support minus the buffer).
- For a short fade, the stop is placed just above the resistance ceiling (resistance plus the buffer).
- The buffer scales with recent volatility, so quieter markets get tighter stops and more active markets get wider ones.
Take-profit logic:
- The take-profit distance is a multiple of the stop distance, set by
RewardRatio. With the default of 1.80, the target sits 1.8 times further from entry than the stop, aiming for a favorable risk-to-reward profile on each fade.
The hedge:
- While a base fade is open, the strategy watches the boundary it is leaning on.
- If a long fade's support decisively breaks (the signal bar closes below support minus the buffer), it opens a short hedge to ride the breakdown.
- If a short fade's resistance decisively breaks, it opens a long hedge to ride the breakout.
- The hedge size is the base size multiplied by
HedgeMultiplier, and it carries its own stop and take-profit. Only one hedge is deployed per cycle; once the trades close out and the system is flat again, its state resets and it waits for the next clean rejection.
Strategy Parameters
| Parameter | Default | Min | Max | Description |
|---|---|---|---|---|
| RangeLookback | 20 | 8 | 60 | Number of completed bars behind the signal bar used to define the support/resistance range. |
| WickFraction | 0.50 | 0.30 | 0.80 | Minimum rejection-wick size as a fraction of the signal bar's full range (pin-bar quality filter). |
| BufferFraction | 0.50 | 0.10 | 1.50 | Boundary zone width and stop buffer, expressed as a fraction of the average bar range in the window. |
| RewardRatio | 1.80 | 0.80 | 4.00 | Take-profit distance as a multiple of the stop distance (risk-to-reward ratio). |
| HedgeMultiplier | 1.50 | 1.00 | 3.00 | Hedge volume relative to the base position when a boundary breaks against the fade. |
| Lots | 0.10 | 0.01 | 1.00 | Base order size in lots. |
Recommended Chart Settings
This strategy was designed as a range/swing tool and tends to be studied on liquid forex pairs such as EUR/USD or GBP/USD, where support and resistance levels form cleanly. Intraday timeframes like M15, M30, and H1 are a natural starting point, since they produce enough rejection candles to study while filtering out a lot of the noise found on very short timeframes.
Keep in mind that boundary behavior differs dramatically between instruments and market regimes. A setting that maps ranges well on one pair during a quiet session may behave very differently on another pair or during high-impact news. Results will vary across different market conditions, and any timeframe or symbol choice should be tested thoroughly before live use.
How to Install on MetaTrader 5
- Download the
DualBoundaryRejectionHedge.ex5file from the link below. - Copy it to your MT5
MQL5\Expertsfolder. - Restart MetaTrader 5 or refresh the Navigator panel.
- Drag the EA onto a chart matching the recommended symbol and timeframe.
- Configure the input parameters and enable Algo Trading.
What to Consider Before Using This EA
Strengths. The logic is transparent and easy to study — it is pure price action, so there are no hidden indicator calculations to interpret. The risk on each base trade is defined up front by a structural stop below support or above resistance, and the reward ratio is explicit. The hedge mechanism is an interesting answer to one of range trading's classic weaknesses: what to do when a boundary you faded turns into a breakout.
Known limitations. Range-fading strategies are, by design, fighting the move at the boundary. In strongly trending or breakout-heavy markets, boundaries break more often, and fades can be stopped out repeatedly before the hedge engages. The hedge itself is not a guaranteed rescue — it can also be stopped out if price whipsaws back through the broken level, and because HedgeMultiplier can increase the position size, a failed hedge can produce a larger loss than the original fade. The strategy also acts only once per bar and deploys only one hedge per cycle, so it will not adapt mid-bar to fast intrabar reversals.
Where it may underperform. Choppy, low-liquidity conditions, news-driven spikes, and sustained trends are all environments where rejection signals may indicate a bounce that never materializes. Wide spreads can also erode the edge on tighter stops. Treat this EA as an educational illustration of combining support/resistance, candlestick rejection, and hedging — not as a strategy that performs uniformly across all markets.
Risk Management Tips
- Size positions deliberately. As a general principle, many educators suggest risking no more than 1–2% of account equity on any single trade. Because the hedge can scale up exposure, account for the combined risk of base trade and hedge when sizing.
- Demo first. Run the EA on a demo account across different pairs, timeframes, and market conditions before considering any live deployment. This lets you observe how often boundaries break and how the hedge behaves in practice.
- Understand drawdown. Even a well-constructed strategy will experience losing streaks. Review historically how a sequence of failed fades could affect your account, and make sure you are comfortable with the worst-case path, not just the average outcome.
- Mind your stops and spreads. Verify that the buffer-based stops sit at sensible distances for the instrument you are trading, and account for spread and slippage, which can be larger on volatile pairs.
- Keep records. Logging your settings and results helps you learn what the strategy does in each regime rather than relying on a single impression.
Risk Warning
Trading foreign exchange, CFDs, and other leveraged financial instruments involves substantial risk of loss and is not suitable for all investors. The strategies and tools discussed on this page are provided for educational purposes only and do not constitute financial advice, investment recommendations, or solicitation to trade. Always consult a qualified financial adviser before making trading decisions. Past backtest performance is not indicative of future results.
Downloads
- Expert Advisor: DualBoundaryRejectionHedge.ex5 (46 downloads)
- Source Code: DualBoundaryRejectionHedge.mq5 (46 downloads)
- Documentation: DualBoundaryRejectionHedge.pdf (49 downloads)