Disclaimer: This article is for educational and informational purposes only. It does not constitute financial or investment advice. Trading forex and CFDs carries significant risk of loss. Past performance of any strategy — including backtests — does not guarantee future results. Never trade with money you cannot afford to lose.
What Is This Strategy?
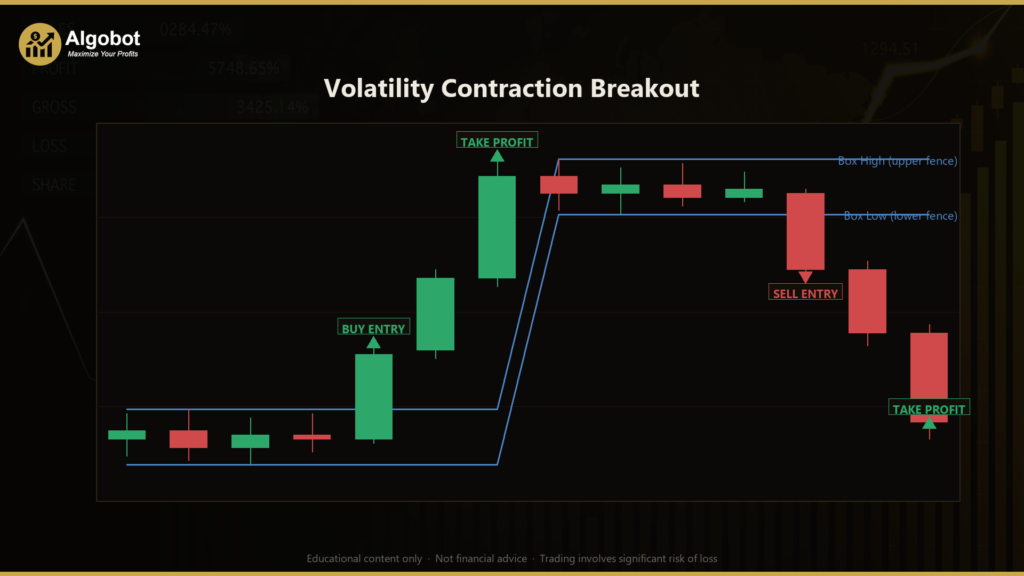
The Volatility Contraction Breakout is a pure price-action breakout strategy that trades the moment a quiet, tightening market expands out of a consolidation range — and it does so without using a single technical indicator. There is no ATR (Average True Range), no moving average, and no oscillator anywhere in the logic. Every decision is derived directly from raw candle data: the open, high, low, and close of each bar. This makes it a clean educational example of how a "volatility contraction pattern" (often abbreviated VCP) can be quantified from price alone.
The core idea is rooted in a well-known market behavior: before a strong directional move, price often "coils." Ranges tighten, each new swing overlaps more with the last, and individual candles get smaller. This calm-before-the-storm phase is sometimes called a squeeze. The strategy measures that contraction by comparing the average bar range of the most recent candles against the average range of the candles just before them. When recent volatility shrinks to a defined fraction of prior volatility, the market is considered "coiled" and ready for a potential expansion.
As a learning tool, this strategy is well suited to traders who want to understand breakout mechanics and structural stop placement without the distraction of lagging indicators. It is designed for trending or expansion-prone conditions rather than persistent sideways chop. It is not a signal of profit — it is a transparent, rules-based framework you can study, backtest, and adapt to deepen your understanding of how consolidation and breakouts behave.
How It Works
The strategy evaluates conditions only once per bar, acting on the candle that has just fully closed (the "breakout candle"). The consolidation box and the volatility windows always sit behind that completed candle. Here is how the logic flows:
- New-bar trigger: The strategy waits for a bar to finish forming. It never acts on the live, incomplete candle, which avoids reacting to noise that may reverse before the bar closes.
- Volatility-contraction (squeeze) test: The strategy calculates the average candle range (High − Low) over the most recent
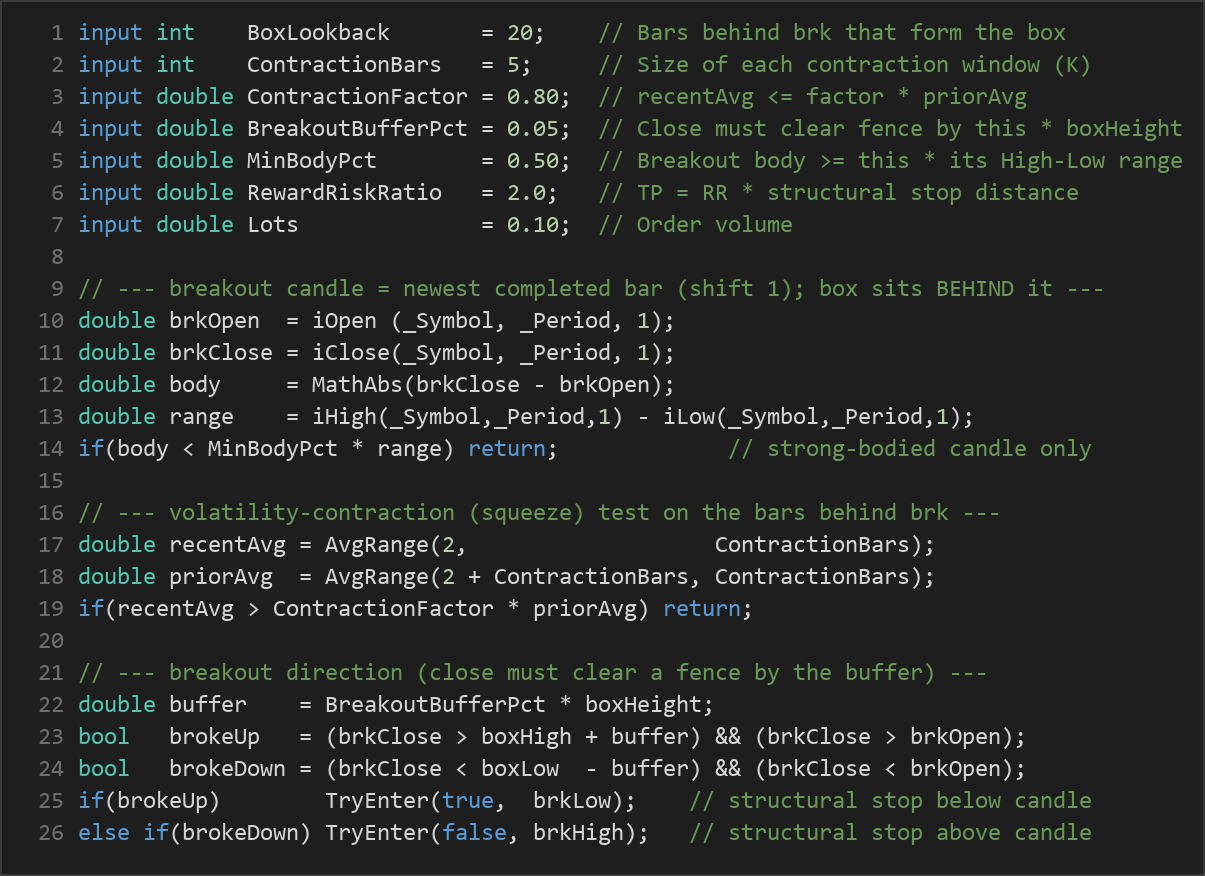
ContractionBarscandles, then compares it to the average range over the priorContractionBarscandles. The squeeze is confirmed only when the recent average is less than or equal toContractionFactor× the prior average. In plain English: the market must have grown measurably quieter.
- The consolidation box: Looking back over
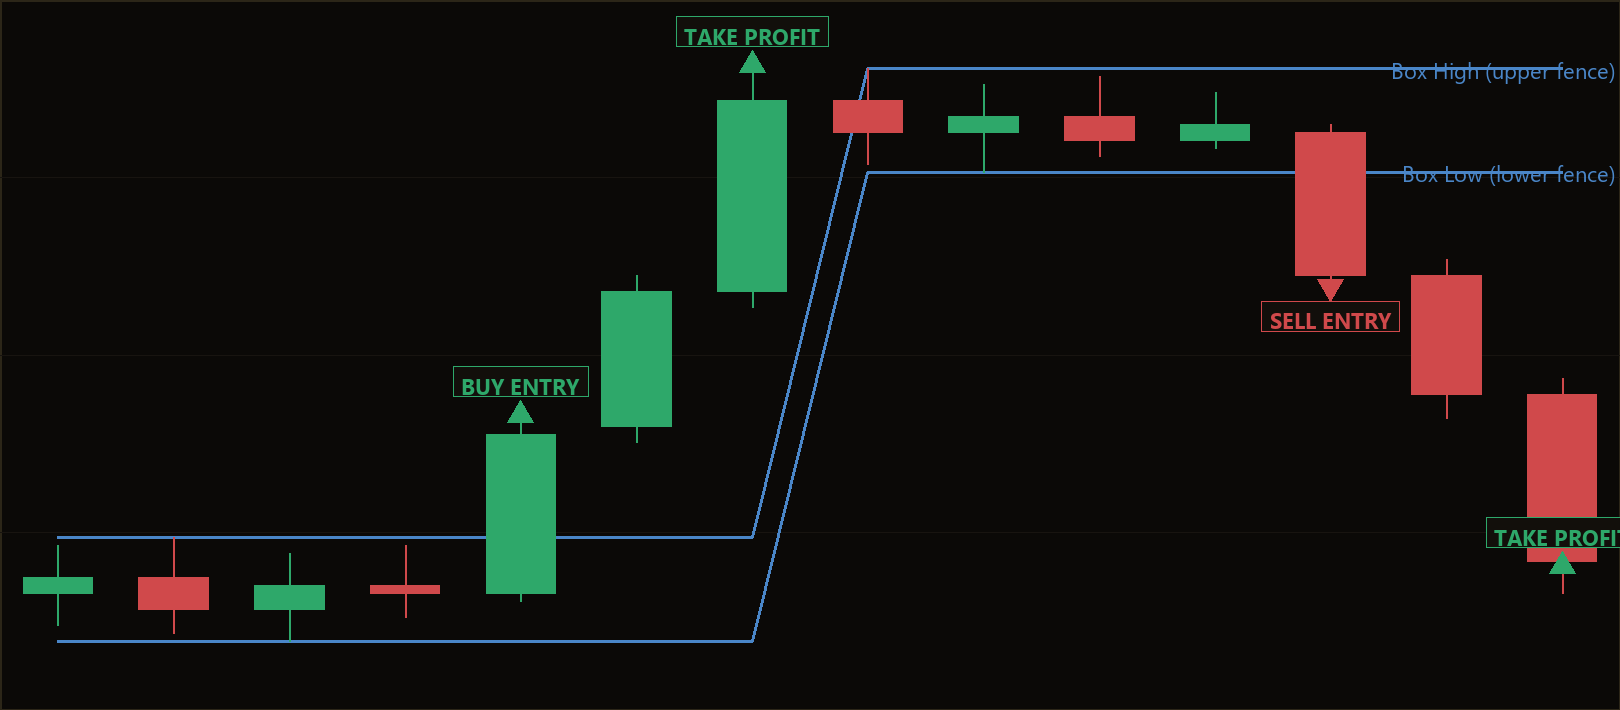
BoxLookbackcandles behind the breakout candle, the strategy records the highest high (the box top) and the lowest low (the box bottom). These two edges are the "fences" that price is pressing against while energy builds.
- Breakout confirmation: A breakout is only trusted when the just-completed candle closes beyond a fence by a buffer equal to
BreakoutBufferPct× the box height. A close above the box top signals a potential long; a close below the box bottom signals a potential short. The buffer helps filter out marginal pokes through the edge.
- Strong-body filter: The breakout candle must be decisive. Its body (the distance between open and close) must be at least
MinBodyPctof its full High−Low range, and it must close in the breakout direction (a bullish candle for longs, bearish for shorts). This screens out weak, indecisive candles with long wicks.
- Entry: When all conditions align, the strategy signals a market entry — buying at the ask for an upside breakout, or selling at the bid for a downside breakout.
- Stop-loss logic: The stop is structural, placed at the opposite extreme of the breakout candle. For a long, the stop sits at the breakout candle's low; for a short, at its high. This ties risk directly to the price structure that produced the signal.
- Take-profit logic: The target is a reward-to-risk multiple. The distance from entry to stop defines the risk, and the take-profit is placed at
RewardRiskRatio× that distance in the direction of the trade.
- One position at a time: The strategy holds only a single open position per magic number, so it will not stack multiple trades on the same symbol simultaneously.
Strategy Parameters
| Parameter | Default | Min | Max | Description |
|---|---|---|---|---|
| BoxLookback | 20 | 10 | 40 | Number of bars behind the breakout candle used to define the consolidation box (highest high and lowest low). |
| ContractionBars | 5 | 3 | 12 | Size of each volatility window — the recent K bars are compared against the prior K bars. |
| ContractionFactor | 0.80 | 0.50 | 1.0 | Squeeze threshold: the recent average range must be ≤ this fraction of the prior average range. Lower values demand a tighter coil. |
| BreakoutBufferPct | 0.05 | 0.0 | 0.30 | The close must clear the box fence by this fraction of the box height before a breakout counts. |
| MinBodyPct | 0.50 | 0.0 | 0.90 | The breakout candle's body must be at least this fraction of its High−Low range, filtering out weak candles. |
| RewardRiskRatio | 2.0 | 1.0 | 5.0 | Take-profit distance as a multiple of the structural stop distance. |
| Lots | 0.10 | 0.01 | 1.0 | Fixed order volume (position size) in lots. |
Recommended Chart Settings
This strategy is timeframe-agnostic by design — every calculation uses the primary timeframe selected at run time, so it will operate on whatever chart period you attach it to. A common starting point for studying breakout behavior is a liquid major forex pair such as EUR/USD on an intraday timeframe like the H1 (1-hour) chart, where consolidation-and-expansion cycles are frequent and easy to observe.
That said, the parameters that define a meaningful "squeeze" and a meaningful "box" differ across symbols and timeframes. A box width and contraction factor that look sensible on H1 EUR/USD may behave very differently on a fast 5-minute chart or a slow daily chart. Always remember that results will vary across different market conditions, instruments, and sessions. Treat the defaults as a baseline for your own backtesting and exploration, not as a finished configuration.
How to Install on MetaTrader 5
- Download the .ex5 file from the link below
- Copy it to your MT5
MQL5\Expertsfolder - Restart MetaTrader 5 or refresh the Navigator panel
- Drag the EA onto a chart matching the recommended symbol and timeframe
- Configure the input parameters and enable Algo Trading
What to Consider Before Using This EA
The main strength of this approach is its transparency. Because there are no indicators to smooth or lag the data, every signal can be traced back to specific candles you can see on the chart. The structural stop also keeps risk anchored to real price levels rather than an arbitrary distance, and the strong-body and buffer filters are sensible attempts to avoid false breakouts.
There are also clear limitations to understand. Breakout systems are, by nature, prone to "false breakouts" — price can close beyond a fence, trigger an entry, and then reverse back into the box. In choppy, range-bound markets with no follow-through, this pattern can produce a series of small losing trades. The strategy also depends heavily on its parameters: too loose a contraction factor and almost any bar qualifies as a squeeze; too tight and signals become rare. Because it uses a fixed lot size, it does not scale position size to account equity or volatility, which is something a more advanced framework might address.
The strategy may underperform during low-volatility drift, during major news spikes that gap past the structural stop, or in instruments with wide spreads relative to the box height. None of this makes the approach "good" or "bad" — it simply means the strategy is a tool whose behavior you should understand and test thoroughly before drawing any conclusions.
Risk Management Tips
Sound risk management matters far more than any single entry rule. Consider these general principles as you study this strategy:
- Position sizing: Size each trade so that a loss at the structural stop represents only a small, predefined slice of your account. Many educational sources suggest risking no more than 1–2% of account equity on any single trade.
- Test on a demo account first: Run the strategy on a demo or simulated account until you understand how it behaves across different sessions and conditions before considering any live use.
- Understand drawdown: Even a well-designed system experiences losing streaks. Knowing the historical depth and duration of drawdown helps you set realistic expectations and avoid abandoning a plan at the worst moment.
- Account for costs: Spreads, commissions, and slippage all eat into breakout trades, especially on shorter timeframes. Include them in any backtest so results reflect reality.
- Keep a journal: Recording why each trade was taken and how it resolved turns every result — win or lose — into a learning opportunity.
Risk Warning
Trading foreign exchange, CFDs, and other leveraged financial instruments involves substantial risk of loss and is not suitable for all investors. The strategies and tools discussed on this page are provided for educational purposes only and do not constitute financial advice, investment recommendations, or solicitation to trade. Always consult a qualified financial adviser before making trading decisions. Past backtest performance is not indicative of future results.
Downloads
- Expert Advisor: VolatilityContractionBreakout.ex5 (67 downloads)
- Source Code: VolatilityContractionBreakout.mq5 (62 downloads)
- Documentation: VolatilityContractionBreakout.pdf (64 downloads)